Writing-up
LEARNING OBJECTIVES
- Write-up and provide interpretation of a linear model analysis with multiple predictors.
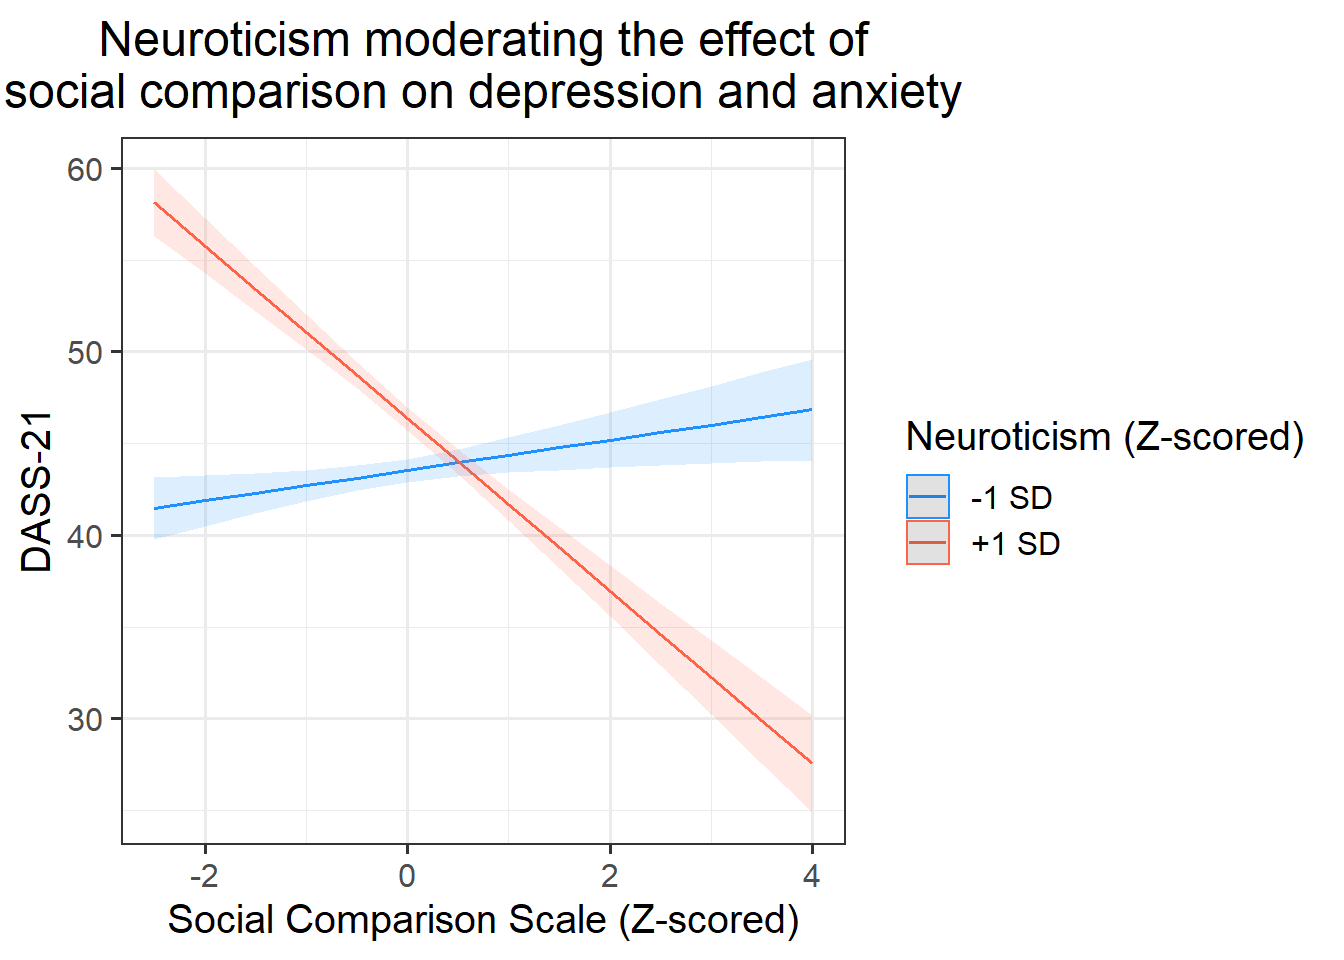
In this lab you will be presented with the output from a statistical analysis, and your job will be to write-up and present the results. We’re going to use an example analysis using one of the datasets we have worked with on a number of exercises in previous labs concerning personality traits, social comparison, depression, and anxiety.
The aim in writing should be that a reader is able to more or less replicate your analyses without referring to your R code. This requires detailing all of the steps you took in conducting the analysis.
The point of using RMarkdown is that you can pull your results directly from the code. If your analysis changes, so does your report!
Make sure that your final report doesn’t show any R functions or code. Remember you are interpreting and reporting your results in text, tables, or plots, targeting a generic reader who may use different software or may not know R at all.
Analysis Strategy
Your analysis strategy will contain a number of different elements detailing plans and changes to your plan. Remember, your analysis strategy should not contain any results. You may wish to include the following sections:
- Very brief data and design description:
- Give the reader some background on the context of your write-up. For example, you may wish to describe the data source, data collection strategy, study design, number of observational units.
- Specify the variables of interest in relation to the research question, including their unit of measurement, the allowed range (for Likert scales), how they are scored, and if they are factors make sure to list the order of the levels.
- Data management:
- Describe any data cleaning and/or recoding.
- Are there any observations that have been excluded based on pre-defined criteria? How/why, and how many?
- * Describe any transformations performed to aid your interpretation (i.e., log transformation, mean centering, standardisation, etc.)
- Model specification:
- Clearly state your hypotheses and specify your chosen significance level.
- What type of statistical analysis do you plan to use to answer the research question? (e.g., t-test, simple linear regression, multiple linear regression, etc.)
- In some cases, you may wish to include some visualisations and descriptive tables to motivate your model specification.
- Specify the model(s) to be fitted to answer your given research question and analysis structure. Clearly specify the response and explanatory variables included in your model(s) and remember to describe the coding of categorical variables (i.e., factors) so the reader is aware of any reference levels.
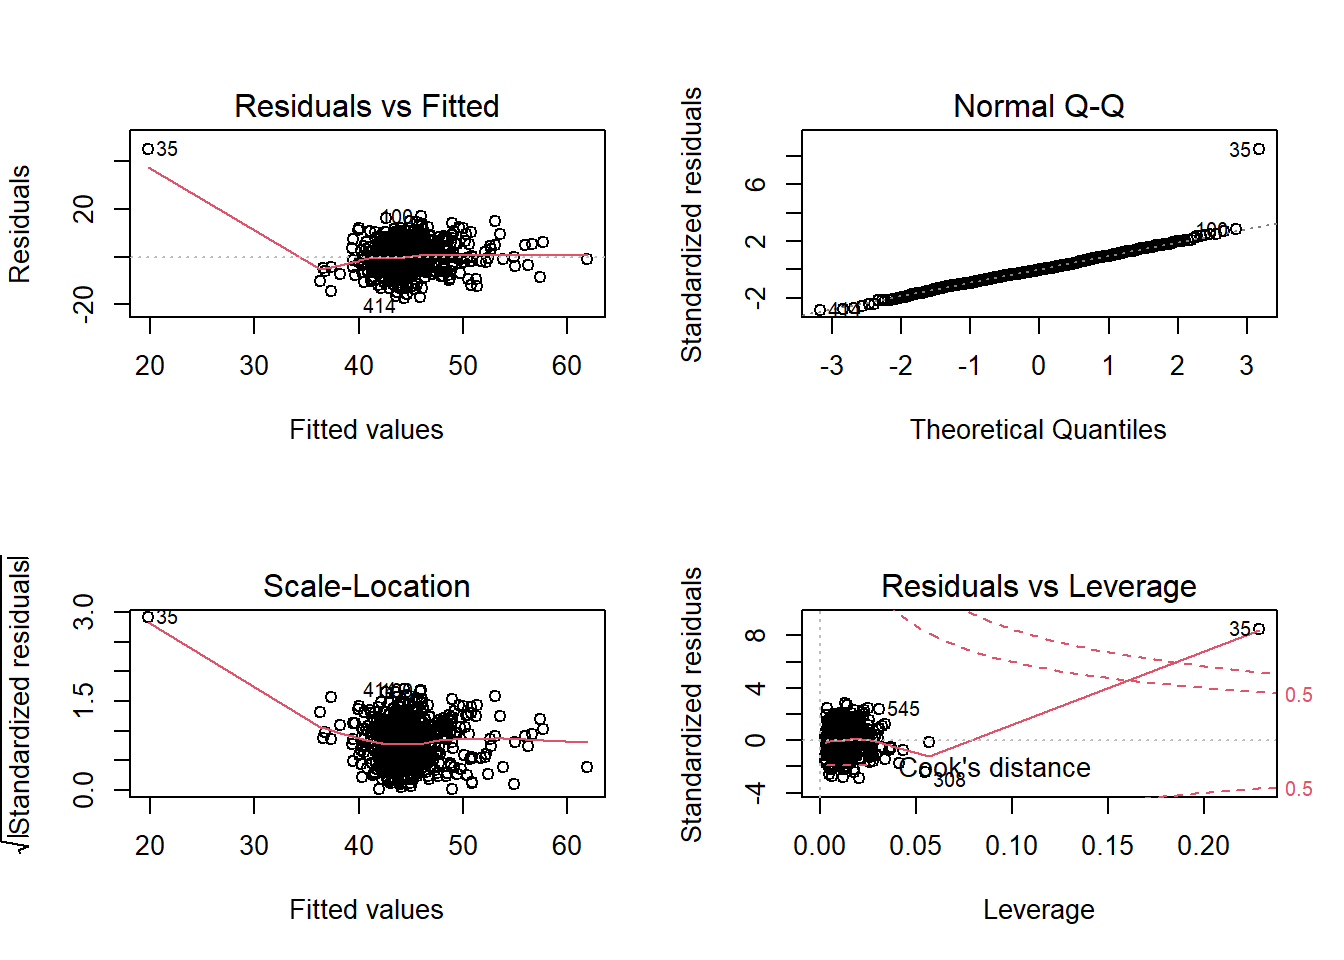
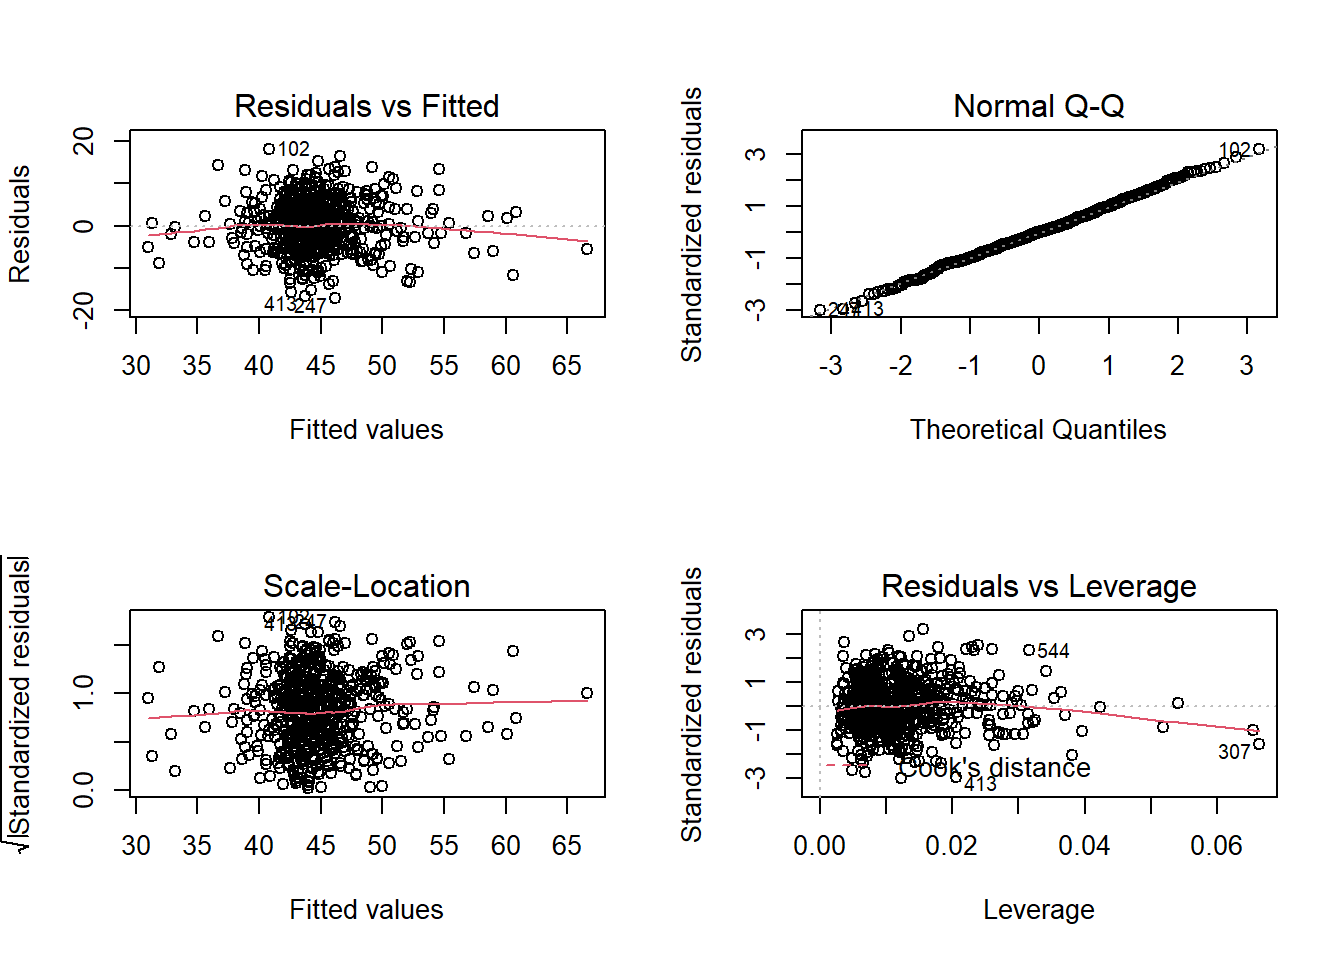
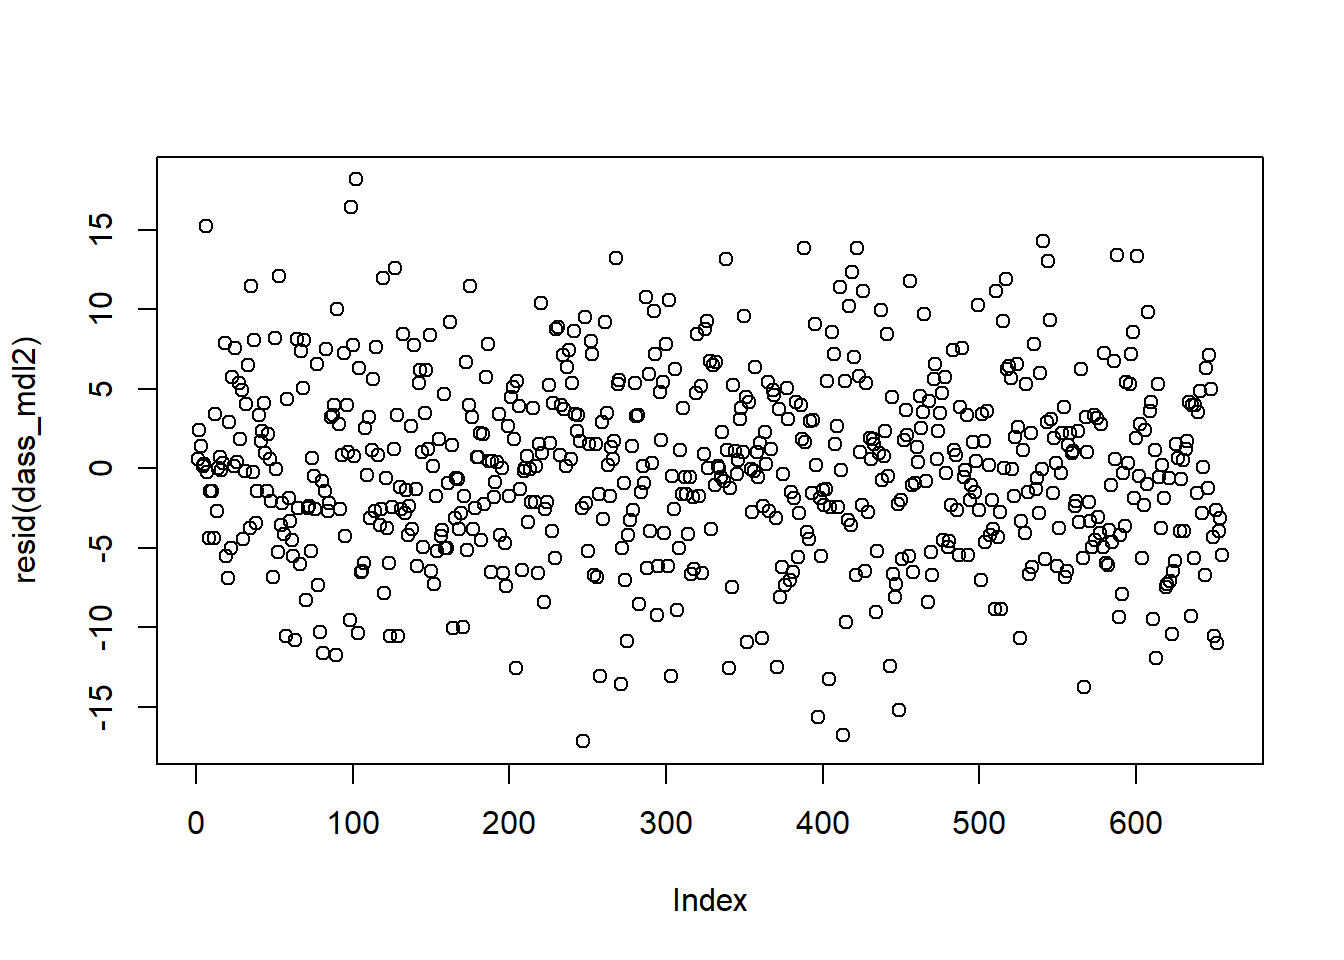
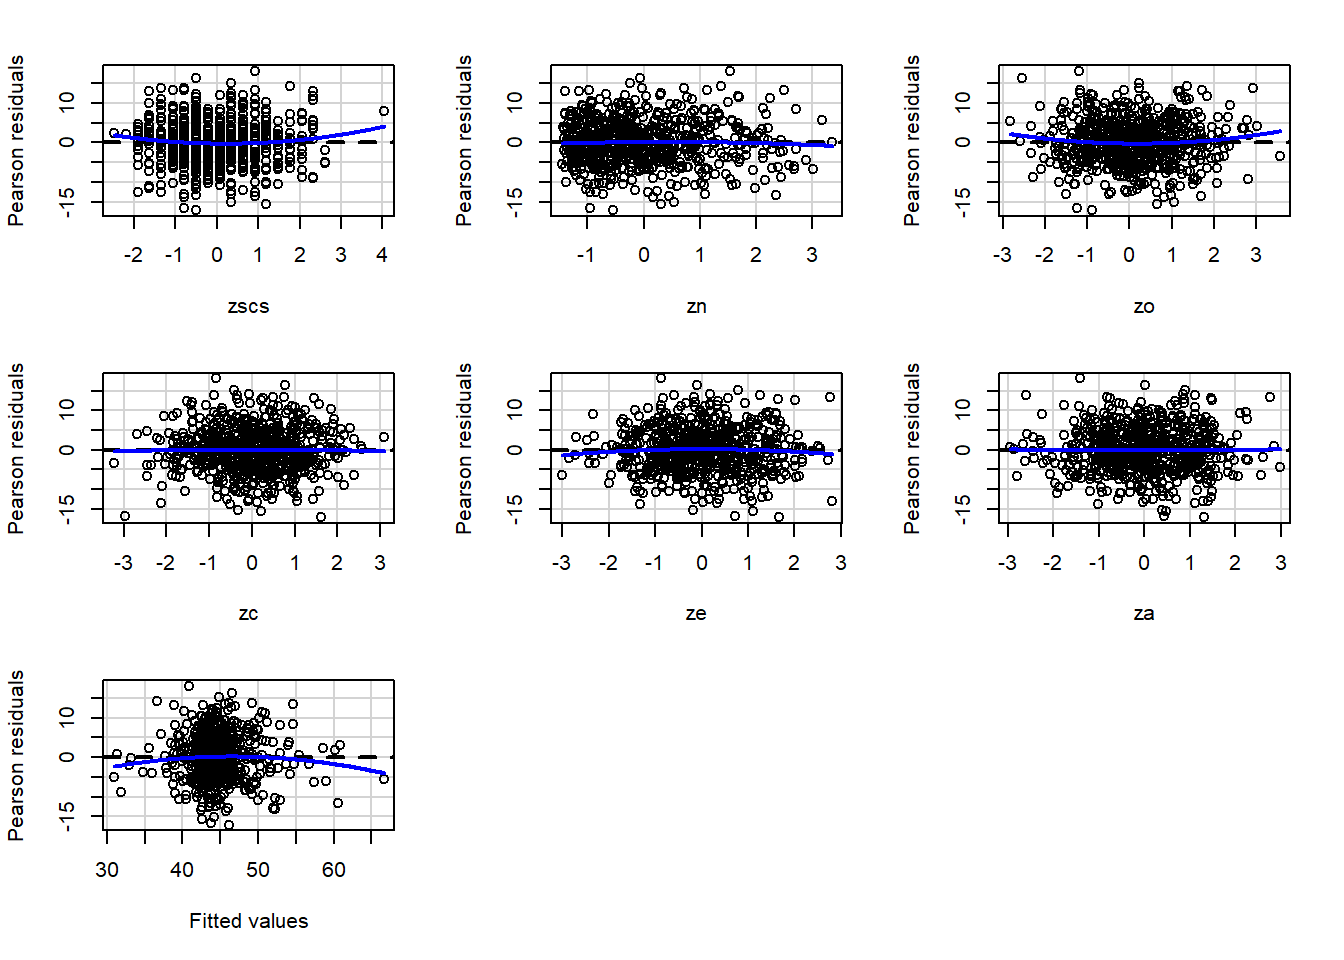
- Detail the steps that you will undertake to ensure that your model(s) do not violate the appropriate assumptions.
- If applicable, detail any required changes/modifications to the model specification to satisfy assumptions. Consider the following: Was there anything you had to do differently than planned during the analysis? Did the modelling highlight issues in your data? Did you have to do anything (e.g., transform any variables, exclude any observations) in order to meet assumptions?
Note that the * used on occasion in the above indicates that you may/should in some cases repeat these steps if you decide to make any modifications to your data (e.g., removing outliers, etc.)
As noted at the start of the lab, one of the main benefits of using RMarkdown is the ability to include inline R code in your document. Try to incorporate this in your write up so you can automatically pull the specified values from your code. If you need a reminder on how to do this, see Lesson 4 of the Rmd Bootcamp: https://uoepsy.github.io//rmd-bootcamp/.
Task 1
Attempt to draft an analysis strategy section based on the above research question and analysis provided.
Results
The results section should follow from your analysis strategy. This is where you would present the evidence and results that will be used to answer the research questions and can support your conclusions. Make sure that you address all aspects of the approach you outlined in the analysis strategy.
In this section, it is useful to include tables and plots to clearly present your findings to your reader. It is important, however, to carefully select what is the key information that should be presented. You don’t want to overload the reader with unnecessary information, and you also want to save space in case there is a page limit. Make use of figures with multiple panels where you can.
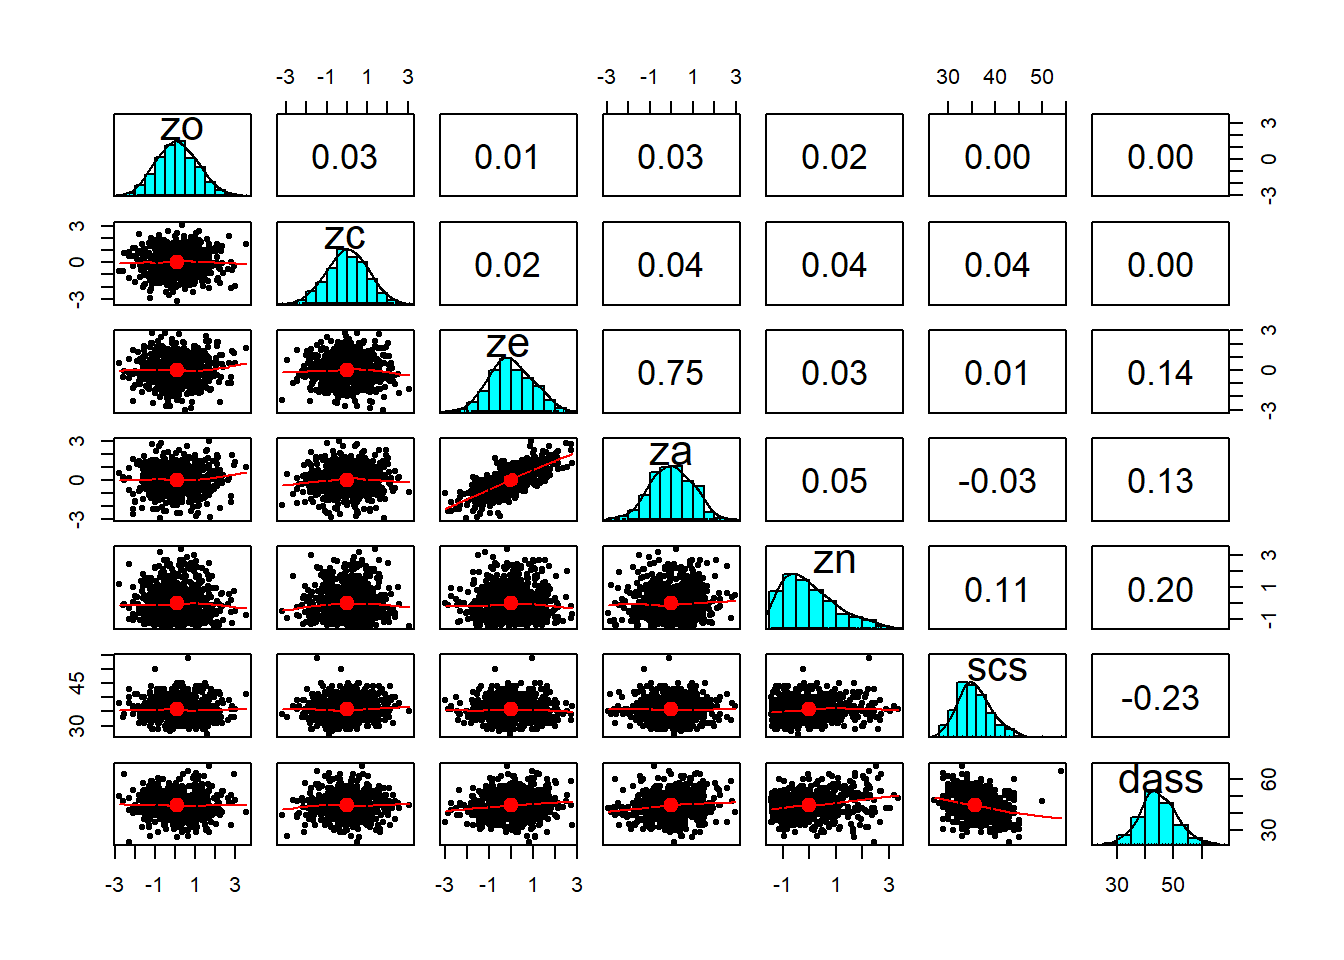
As a broad guideline, you want to start with the results of an exploratory data analysis, presenting tables of summary statistics and exploratory plots. You may also want to visualise relationships between variables and report covariances or correlations. Then, you should move on to the results from your model. Remember that in the main part of the report you should only interpret and report for models that do not violate the assumptions. You should also interpret all of the results presented, and remember to make reference to and comment on your assumption and diagnostic checks for key models.
Task 2
Attempt to draft a results section based on your detailed analysis strategy and the analysis provided.

Discussion
In the discussion section, you should summarise the key findings from the results section and provide the reader with take-home sentences drawing the analysis together and relating it back to the original question.
The discussion should be relatively brief, and should not include any statistical analysis - instead think of the discussion as a conclusion, providing an answer to the research questions.
Task 3
Attempt to draft a discussion section based on your results and the analysis provided.
Tying it all together
All the component parts we have just written in the exercises above can be brought together to make a reasonable draft of a statistical report. There is a lot of variability in how to structure the reporting of statistical analyses, for instance you may be using the same model to test a selection of different hypotheses.
The answers contained above are just an example of how you can structure and write each section. While we hope it will serve as a useful reference when you are writing your report, but it should not be taken as an exemplary template for a report which would score 100%.
On the Learn page, we have also included the RMarkdown file used to create this report, which may be useful to see how things such as formatting and using inline R code can be used.
Why not try downloading and compiling it to see how it works?