Interactions: Categorical * Categorical
Be sure to check the solutions to last week’s exercises.
You can still ask any questions about previous weeks’ materials if things aren’t clear!
LEARNING OBJECTIVES
- Interpret interactions for between two categorical variables (dummy coding).
- Visualize and probe interactions.
- Be able to read interaction plots.
Research question
A group of researchers wants to test an hypothesised theory according to which the difference in performance between explicit and implicit memory tasks will be greatest for Huntington patients in comparison to controls.
On the other hand, the difference in performance between explicit and implicit memory tasks will not significantly differ between patients with amnesia in comparison to controls.
Data
Description
The researchers designed a study yielding a 3 by 2 factorial design to test this theory. The first factor, “Diagnosis,” classifies the three types of individuals:
- 1 denotes amnesic patients;
- 2 denotes Huntingtons patients; and
- 3 denotes a control group of individuals with no known neurological disorder.
The second factor, “Task,” tells us to which of two tasks each study participant was randomly assigned to:
- 1 = grammar task, which consists of classifying letter sequences as either following or not following grammatical rules; and
- 2 = recognition task, which consists of recognising particular stimuli as stimuli that have previously been presented during the task.
Keep in mind that each person has been randomly assigned to one of the two tasks, so there are five observations per cell of the design.1
The tasks chosen by the researchers have been picked to map onto the theoretical differences between the three types of research participants. The first task (grammar) is known to reflect implicit memory processes, whereas the recognition task is known to reflect explicit memory processes. If the theory is correct, we would expect the difference in scores between the recognition and grammar tasks to be relatively similar for the control and amnesiac groups, but relatively larger for the Huntingtons group compared to controls.
Preview
The first ten rows of the data are:
Exercises
Read the data into R, and perform all the appropriate data management steps:
- Convert categorical variables to factors
- Label appropriately factors to aid with your model interpretations
- If needed, provide better variable names
Choose appropriate reference levels for the factors.
Specify a multiple regression model to test the research hypothesis.
Fit the specified model using R and store the model in an object named mdl_int.
Create a table of group means, and map each coefficient to the group means.
Load the sjPlot package and try using the function plot_model() to investigate the interactions.
Hint
Remember from last week that the default behaviour of plot_model() is to plot the parameter estimates and their confidence intervals. This is where type = “est” will come handy.
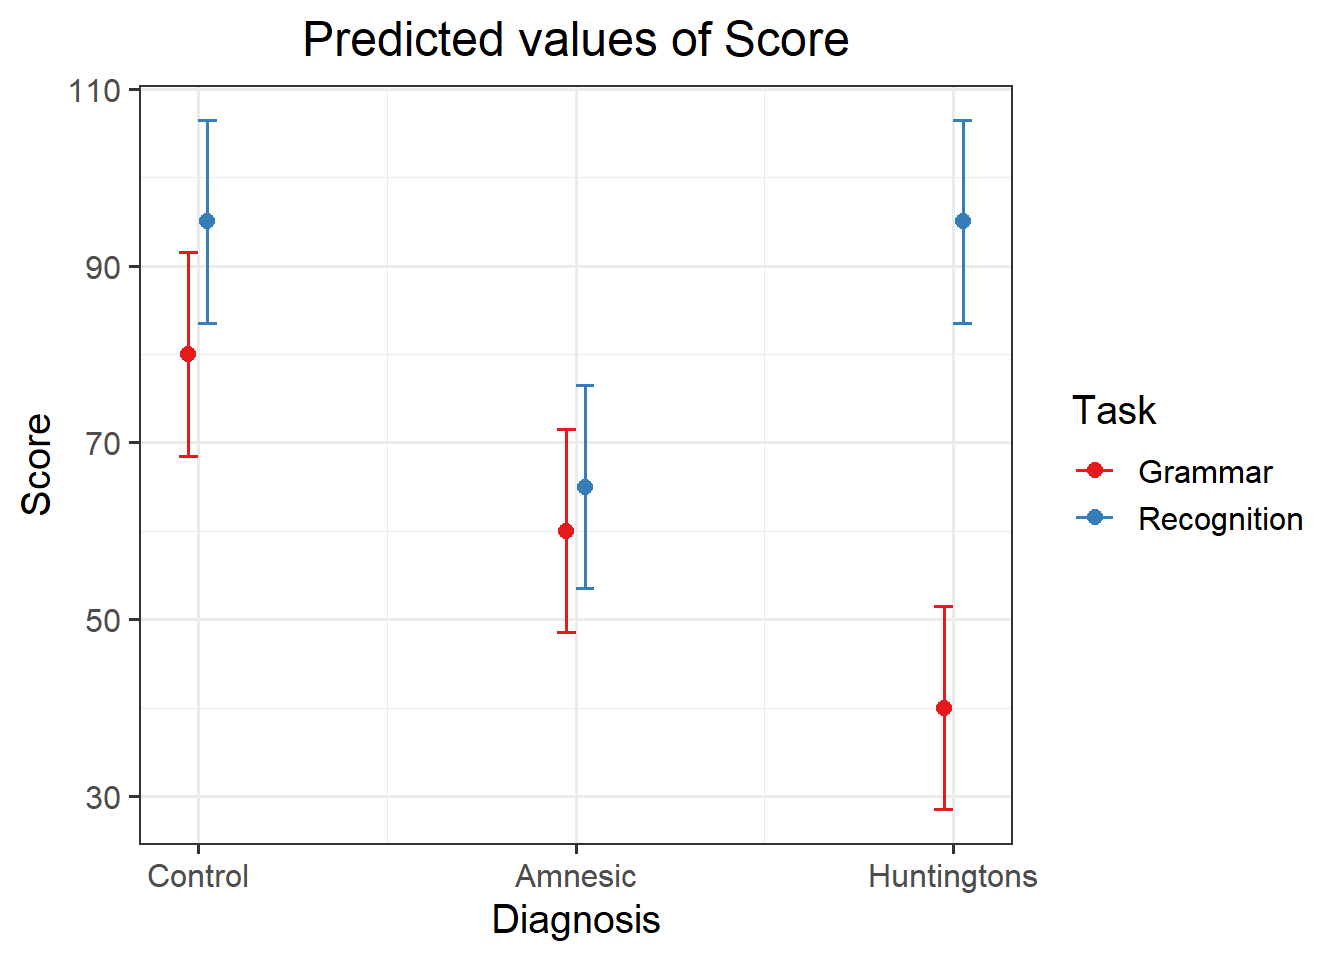
Visualising the interactions
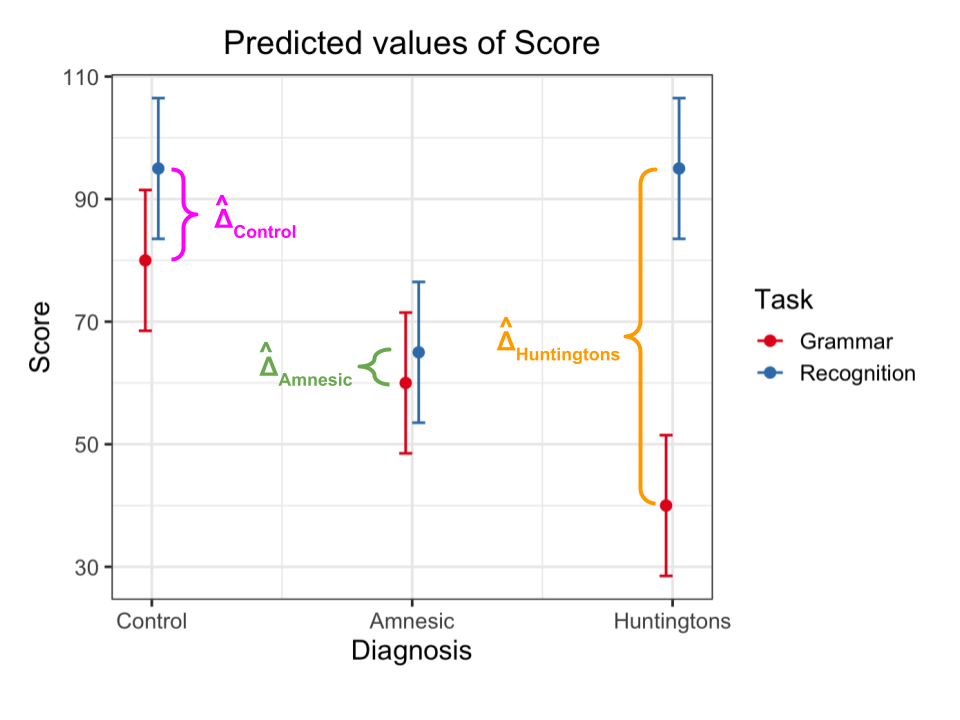
In the interaction plot above you can see three highlighted differences, where the differences are denoted with the Greek letter \(\Delta\) (“delta”) with a hat on top, \(\hat \Delta\), to denote that those are estimates for the unknown population differences based on the available sample data. The corresponding population differences are unknown as we don’t have the data for the entire population, and they are denoted with a \(\Delta\) without a hat on top.
You can see highlighted:
- The difference in the mean score between Recognition and Grammar for Control patients, \(\hat \Delta_{\text{Control}}\)
- The difference in the mean score between Recognition and Grammar for Amnesic patients, \(\hat \Delta_{\text{Amnesic}}\)
- The difference in the mean score between Recognition and Grammar for Huntingtons patients, \(\hat \Delta_{\text{Huntingtons}}\)
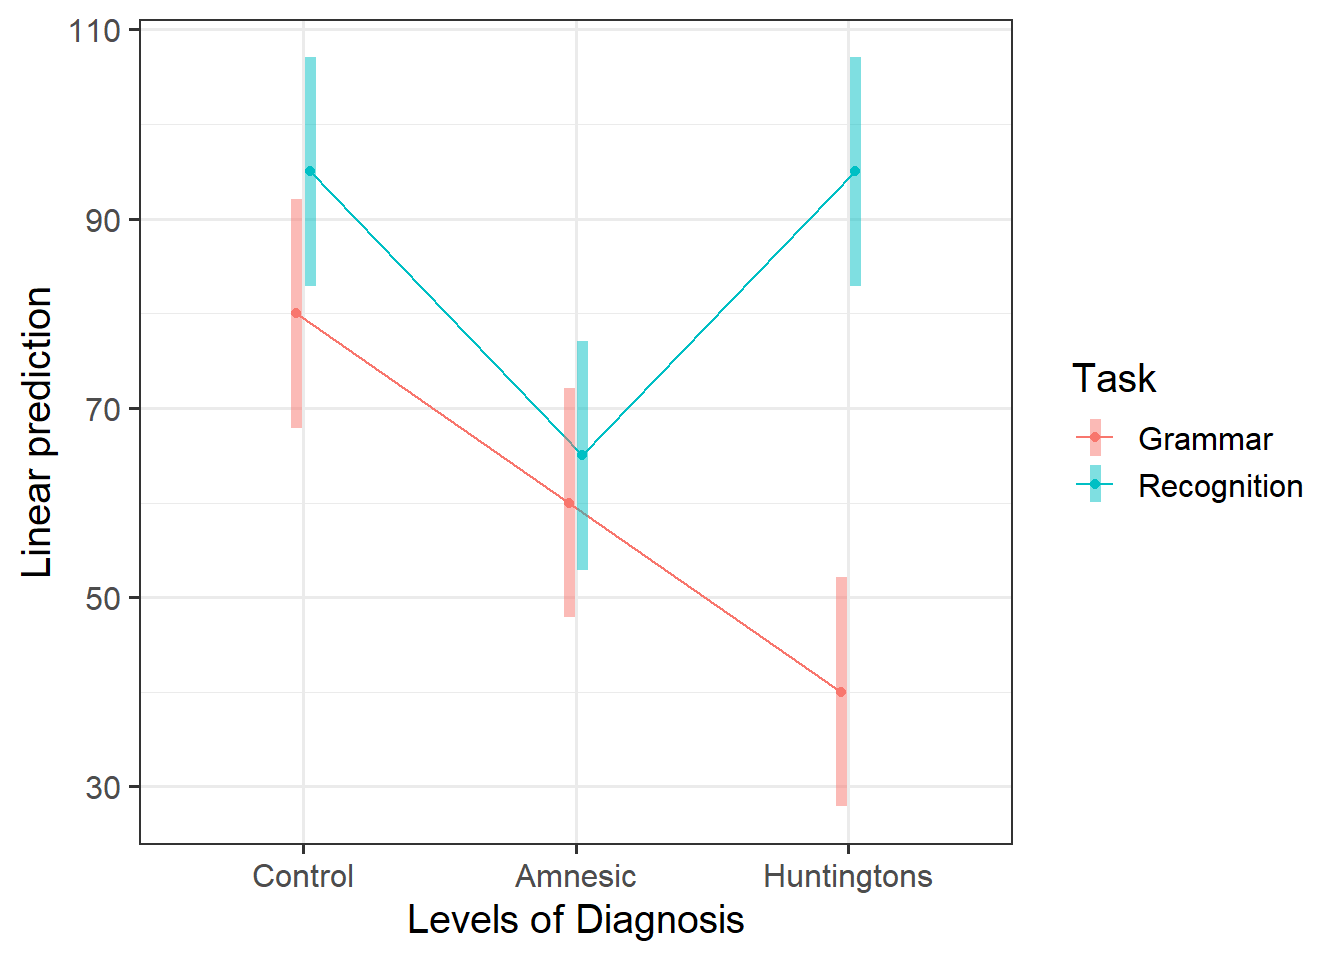
An interaction is present if the effect of Task (i.e. the difference in mean score between Recognition and Grammar tasks) substantially varies across the possible values for Diagnosis. That is, if the difference for Amnesic is not the same as that for Control, or if the difference for Huntingtons is not the same as that for Control, or both.
The model summary returns two rows for the interactions. Let’s focus on this row:
## DiagnosisAmnesic:TaskRecognition -10.000 11.719 -0.853 0.40192 It returns an estimate for the difference
\[ \hat \beta_4 = \hat \Delta_{\text{Amnesic}} - \hat \Delta_{\text{Control}} \]
and also performs a test for the hypothesis that the differences are equal in the population:
\[ H_0: \Delta_{\text{Amnesic}} = \Delta_{\text{Control}} \\ H_1: \Delta_{\text{Amnesic}} \neq \Delta_{\text{Control}} \]
or, equivalently, that:
\[ H_0: \Delta_{\text{Amnesic}} - \Delta_{\text{Control}} = 0 \\ H_1: \Delta_{\text{Amnesic}} - \Delta_{\text{Control}} \neq 0 \]
Let’s now focus on the last row:
## DiagnosisHuntingtons:TaskRecognition 40.000 11.719 3.413 0.00228 ** It returns an estimate for the difference
\[ \hat \beta_5 = \hat \Delta_{\text{Huntingtons}} - \hat \Delta_{\text{Control}} \]
and also performs a test for the hypothesis that the differences are equal in the population:
\[ H_0: \Delta_{\text{Huntingtons}} = \Delta_{\text{Control}} \\ H_1: \Delta_{\text{Huntingtons}} \neq \Delta_{\text{Control}} \]
or, equivalently, that:
\[ H_0: \Delta_{\text{Huntingtons}} - \Delta_{\text{Control}} = 0 \\ H_1: \Delta_{\text{Huntingtons}} - \Delta_{\text{Control}} \neq 0 \]
Interpret the model output in the context of the research hypothesis.

Some researchers may point out that a design where each person was assessed on both tasks might have been more efficient. However, the task factor in such design would then be within-subjects, meaning that the scores corresponding to the same person would be correlated. To analyse such design we will need a different method which is discussed next year!↩︎