| Diagnosis | grammar | classification | recognition |
|---|---|---|---|
| amnesic | 44, 63, 76, 72, 45 | 72, 66, 55, 82, 75 | 70, 51, 82, 66, 56 |
| huntingtons | 24, 30, 51, 55, 40 | 53, 59, 33, 37, 43 | 107, 80, 98, 82, 108 |
| control | 76, 98, 71, 70, 85 | 92, 65, 86, 67, 90 | 107, 80, 101, 82, 105 |
Simple Effects, Pairwise Comparisons, Corrections
Learning Objectives
At the end of this lab, you will:
- Understand how to interpret simple effects for experimental designs
- Understand how to conduct pairwise comparisons
- Understand how to apply corrections available for multiple comparisons
What You Need
Required R Packages
Remember to load all packages within a code chunk at the start of your RMarkdown file using library(). If you do not have a package and need to install, do so within the console using install.packages(" "). For further guidance on installing/updating packages, see Section C here.
For this lab, you will need to load the following package(s):
- tidyverse
- psych
- kableExtra
- stargazer
- patchwork
- emmeans
Lab Data
You can download the data required for this lab here or read it in via this link https://uoepsy.github.io/data/cognitive_experiment.csv. Note, you have already worked with some of this data before - see Semester 1 week 8 lab, but we now have a third Task condition - Classification.
Study Overview
Research Question
Are there differences in types of memory deficits for those experiencing different cognitive impairment(s)?
In this week’s exercises, we will further explore questions such as:
- Does level \(i\) of the first factor have an effect on the response?
- Does level \(j\) of the second factor have an effect on the response?
- Is there a combined effect of level \(i\) of the first factor and level \(j\) of the second factor on the response? In other words, is there interaction of the two factors so that the combined effect is not simply the additive effect of level \(i\) of the first factor plus the effect of level \(j\) of the second factor?
Setup
- Create a new RMarkdown file
- Load the required package(s)
- Read the cognitive_experiment dataset into R, assigning it to an object named
cog
Firstly, examine the dataset, and perform any necessary and appropriate data management steps.
Next, consider would be the most appropriate coding constraint to apply in order to best address the research question - i.e., are we interested in whether group X (e.g., Amnesic) differed from group Y (e.g., Huntingtons), or whether group X (e.g., Amnesic) differed from the global/grand mean?
Make any appropriate changes to reference levels if required based on your decision above.
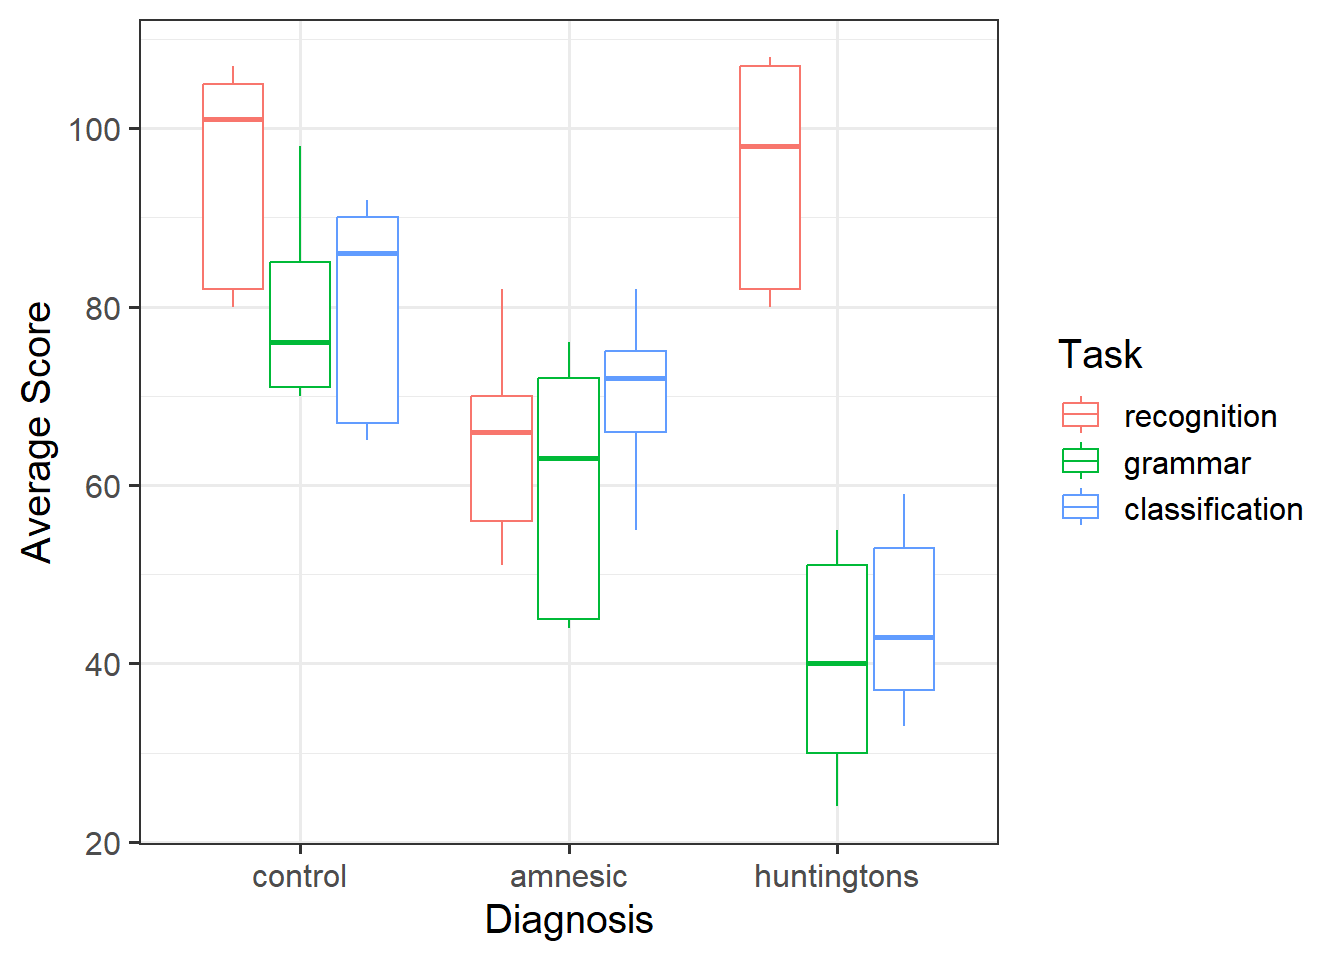
Provide a table of descriptive statistics and visualise your data.
Remember to interpret your plot in the context of the study (i.e., comment on any observed differences among treatment groups).
- For your table of descriptive statistics, both the
group_by()andsummarise()functions will come in handy here. - Recall that when visualising a continuous outcome across several groups,
geom_boxplot()may be most appropriate to use. - Make sure to comment on any observed differences among the sample means of the four treatment conditions.
Formally state:
- the linear model(s) to investigate whether there are differences in Score based on Diagnosis and Task conditions
- your chosen significance level
- the null and alternative hypotheses
Fit the specified models, and assign them the names “mdl_add” and “mdl_int” as appropriate.
Provide key model results from the two models in a single formatted table, and report the results of the model comparison in APA format.
Contrast analysis
We will now begin by looking at each factor separately.
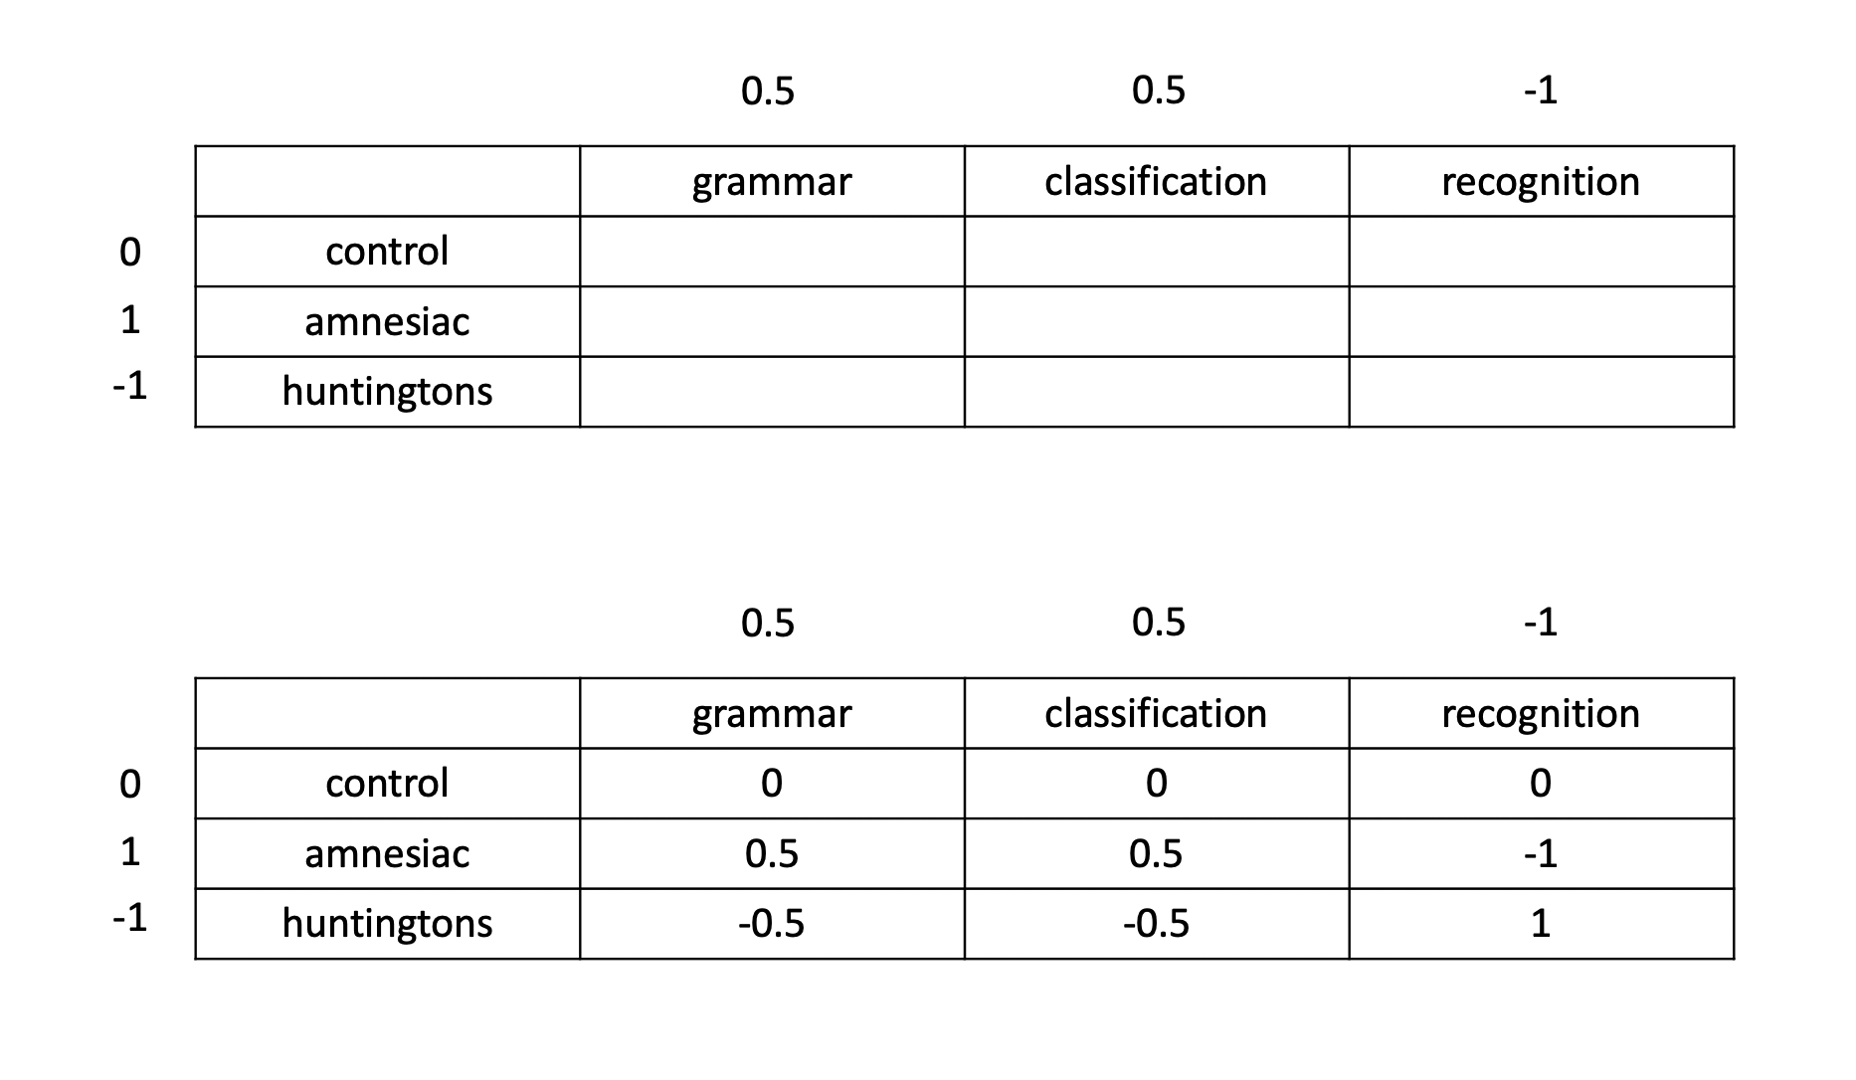
In terms of the diagnostic groups, we want to compare the amnesiacs to the Huntington individuals. This corresponds to a contrast with coefficients of 0, 1, and −1, for control, amnesic, and Huntingtons, respectively.
Similarly, in terms of the tasks, we want to compare the average of the two implicit memory tasks with the explicit memory task. This corresponds to a contrast with coefficients of 0.5, 0.5, and −1 for the three tasks.
When we are in presence of a significant interaction, the coefficients for a contrast between the means are found by multiplying each row coefficient with all column coefficients as shown below:

Specify the contrast weights in R, and state the null hypothesis of your contrast analysis.
Run the contrast analysis, and interpret your output in the context of the research question.
Simple Effects
By considering the simple effects1, we can identify at which levels of the interacting condition we see different effects.
Examine the simple effects for Task at each level of Diagnosis; and then the simple effects for Diagnosis at each level of Task.
Visualise the interaction, displaying two plots - one with Diagnosis on the x-axis, and the other with Task on the x-axis.
Considering the simple effects that we noted above, identify the significant effects and match them to the parts of your interaction plot.
To visualise the interaction, you can use emmip().
Recall that the patchwork package allows us to arrange multiple plots using either / or | or +
Pairwise Comparisons & Multiple Corrections
Conduct exploratory pairwise comparisons to compare all levels of Diagnosis with all levels of Task, applying no correction (note that Tukey will be automatically applied since we are comparing groups of means, so you will need to overwrite this).
Without adjusting our \(\alpha\) (or \(p\)-value), why might any inferences drawn from your output be problematic?
You can specify the adjustment using adjust = ". Possible options include:
adjust = "none"adjust = "bonferroni"adjust = "sidak"adjust = "Tukey"adjust = scheffe"
Select an appropriate method to adjust for multiple comparisons, and then obtain confidence intervals.
Comment on how these \(p\)-values differ from your raw (i.e., unadjusted) \(p\)-values.
Footnotes
simple effects are the effects of one variable at a specific level of another variable↩︎


