| Variable | Description |
|---|---|
| license_year | Year in which license was issued |
| license_number | Unique license ID number |
| animals_name | Full name of pet |
| species | Species of pet |
| primary_breed | Primary breed of pet |
| secondary_breed | Secondary breed of pet |
| weight_kg | Weight in kilograms |
Week 1 Exercises: Intro R
First things
The very first things to do are to open RStudio and get a blank script ready for writing your code.
Our recommendation is that you have an R project for this course, and use a new script for each week of work. See the tip about “R projects” in Section 1A.
Pet Data
We’re going to play with some data on a sample of licensed pets from the city of Seattle, USA. It can be downloaded (or read directly into R) from https://uoepsy.github.io/data/pets_seattle.csv. It contains information on the license ID, year of issue, as well as the species, breeds and weights of each pet. You can find a data dictionary in @tab-petdict
Question 1
Write a line of code that reads in the data to your R session. Then examine the dimensions of the dataset, and take a look at the first few lines lines.
Hints: You’ll need the read.csv() function. Remember to assign it a name to store it in your environment. 1B #basic-data-wrangling contains an example of reading in data from a URL. You’ll then want to play with functions like dim() and head().
We’re going to call it petdata. Don’t forget the quotation marks around the url (otherwise R will look for an object in your environment called https://..., which isn’t there).
[1] 1956 7 license_year license_number animals_name species primary_breed
1 2018 LNS150171 Norman Dog Boxer
2 2017 LN20666 Henry Dog Bichon Frise
3 2018 LN8000658 Vega Williams Dog Mix
4 2018 LN730940 Molly Dog Australian Shepherd
5 2016 LN964607 Gremy Dog Chihuahua, Short Coat
6 2018 LNS117115 Shadow Dog Retriever, Labrador
secondary_breed weight_kg
1 Mix 29.15
2 Havanese 23.70
3 Unknown 21.13
4 Mix 18.70
5 Terrier 20.36
6 Unknown 11.51
Question 2
What are the names of the 47th and the 200th animals in the dataset?
Hints: You’ll probably want to make use of the square brackets data[rows, columns].
Lots of different ways. We can get out the entire rows:
   license_year license_number animals_name species       primary_breed
47         2018      LNS140233     Hooligan     Dog Retriever, Labrador
   secondary_breed weight_kg
47 Unknown 12.27 license_year license_number animals_name species primary_breed
200 2017 LN584186 Maple Syrup Cat Domestic Shorthair
secondary_breed weight_kg
200 Unknown 4.66Or we can extract the names only:
[1] "Hooligan" "Maple Syrup"In the last one, we use the $ to access the animals_name variable. In this case, we don’t need to specify [rows, columns] inside the square brackets, because it’s a single variable - there are no columns.
dataframe[rows, columns]
variable[entries]
Question 3
Subset the data to only the data for the dogs, and store this object as another named object in your environment. Subset the data to only the data for the cats, and store this object as another named object in your environment.
Hints: You’ll want to think about how we access data via asking for those entries that meet a specific condition (see 1B #accessing-by-a-condition)
We can ask “which entries of species variable are equal to ‘Dog’?” by using pet$species=="Dog".
This will give us a TRUE for each dog, and a FALSE for each non-dog.
We can then use this set of TRUEs and FALSEs to access those rows for which it is TRUE in our data:
Question 4
Find the name and weight of the heaviest cat, and of the lightest dog.
Hints: You could do this using the original data you read in from question 1, or use the subsets you created in question 3. You’ll again want to supply a condition within square brackets. That condition may well have something to do with being equal to the min() or the max() of some variable.
We can use min() and max() to return the minimum and maximum of a variable:
We could then ask for each entry “is this cat’s weight the maximum cat’s weight?” with catdata$weight_kg == max(catdata$weight_kg) and then use that condition to access the rows in our dataset where the weight_kg variable is at its maximum:
    license_year license_number animals_name species      primary_breed
414         2018      LNS101014       Smokey     Cat Domestic Shorthair
    secondary_breed weight_kg
414 Mix 5.48 license_year license_number animals_name species primary_breed
1126 2017 LNS139134 Claire Dog Great Pyrenees
secondary_breed weight_kg
1126 Unknown 0.39
Question 5
Does the data contain only dogs and cats?
Hints: Given what you did in question 3, you might be able to answer this by just looking at your environment.
In the environment, we can see that the entire dataset has 1956 observations, the Dog’s data frame has 1322, and the Cat’s has 632.
So there are 2 missing!
Question 6
Extract the entries of the dataset for which the species is neither “Dog” nor “Cat”? What are the names and species of these animals?
Hints: This is a slightly complex one. 1B #more-complex-conditions might help you here.
We can ask if something is not a dog by using petdata$species != "Dog". But we want the rows where the species is not a dog and it’s not a cat. So it’s two conditions:
     license_year license_number     animals_name species primary_breed
1505         2018      LNS147013    Billy the Kid    Goat     Miniature
1655         2018      LNS132953 Vincent Van Goat    Goat     Miniature
     secondary_breed weight_kg
1505         Unknown    103.48
1655         Unknown     73.96
We could also do this in other ways, such as asking for all the entries which are either “Dog” or “Cat”, and then negating them:
Another clever little operator is the %in% operator, which asks whether something is in a set of things. Unfortunately, we can’t use !%in% to mean “not in”, so we need to put the ! right at the start of the condition:
license_year license_number animals_name
1 2018 LNS150171 Norman
2 2017 LN20666 Henry
3 2018 LN8000658 Vega Williams
4 2018 LN730940 Molly
5 2016 LN964607 Gremy
6 2018 LNS117115 Shadow
7 2018 LNS141621 Gaspode
8 2016 LN82467 Juno
9 2018 LN444211 Nelly
10 2018 LNS123412 Wallingford
11 2018 LN444317 Narla
12 2018 LN956537 Friday
13 2018 LN731014 Gemma
14 2017 LNS136927 Hawk
15 2018 LNS142280 Lucy
16 2017 LN820082 Keke
17 2018 LN829593 Rusty
18 2018 LNS140453 Bear
19 2018 LNS119960 Charlie
20 2017 LNS130739 Maxwell
21 2018 LN8002090 Madoka
22 2018 LN8000712 Tiberius
23 2018 LNS135817 Jade
24 2018 LNS116961 Boo
25 2018 LN445210 Cricket
26 2017 LN273434 Knowlee
27 2017 LNS100900 Sophie
28 2018 LN8003462 Spencer
29 2017 LN571784 Julie
30 2018 LNS114782 Pumpkin
31 2018 LNS109674 Miss Emily
32 2018 LN8002207 Snerfu
33 2018 LNS139692 Sadie
34 2018 LN727071 Rocky
35 2018 LNS126133 Pepper
36 2017 LN437192 Tati
37 2018 LN83704 Lucille
38 2018 LNS116225 Jonesy
39 2018 LN8000164 Lucy
40 2018 LNS140445 Milo
41 2018 LNS145495 Rowan
42 2018 LNS135890 Zac
43 2018 LN8001371 Kingston
44 2017 LN85250 Pepe
45 2018 LNS108784 Milo
46 2018 LNS110853 Scout
47 2018 LNS140233 Hooligan
48 2018 LNS142822 Mowgli
49 2018 LN210596 Poirot
50 2018 LN584571 Viejo
51 2018 LNS112770 Jeremy
52 2018 LN82283 Gozer
53 2018 LN586694 Max
54 2018 LNS136912 Rupert
55 2018 LNS141582 Misty
56 2018 LNS147169 Sami
57 2018 LN83858 Banjo
58 2018 LN8001742 Reva
59 2018 LN216519 Archimedes
60 2018 LNS146850 Winnie
61 2017 LN438540 Rose
62 2018 LN436387 Teak
63 2018 LNS135444 Benny
64 2018 LNS116946 Dash
65 2017 LN70054 Nina
66 2018 LN8001311 Cedar
67 2018 LNS145317 Ceili
68 2018 LNS129123 Dempsey
69 2018 LNS139926 Gracie
70 2017 LNS100935 Sherman
71 2017 LN28324 Rue
72 2018 LN133956 Woody
73 2018 LN142557 Rachel
74 2018 LNS102723 Molly
75 2017 LN964733 Watson
76 2018 LNS103640 Fare
77 2018 LN8001682 Pepper
78 2017 LN277198 Stewie
79 2018 LN905176 Whiskers
80 2017 LN128002 Percival
81 2018 LN8000762 Luke
82 2018 LN8003671 Clyde
83 2018 LNS142341 Bellatrix
84 2018 LNS140325 Cherry
85 2018 LNS112676 Ouzo
86 2017 LNS130671 Timbus
87 2017 LN731268 Pepper
88 2018 LN77682 Wash
89 2018 LN8002261 Kyuss
90 2017 LN833095 Esme
91 2017 LNS130231 Farah
92 2018 LNS147519 Oliver
93 2017 LN284855 Maxwell
94 2018 LNS129706 Maple
95 2018 LN8002369 Cayman
96 2018 LN422768 Buddy
97 2017 LN216537 Winston
98 2017 LN442592 Belle
99 2018 LN8001247 Barkley
100 2018 LNS139966 Miso
101 2018 LN138324 Miki
102 2018 LN730563 Pepi
103 2018 LN26346 Ruby
104 2018 LNS133370 Alvin
105 2017 LNS143602 Daisy
106 2018 LN899888 Maya
107 2017 LN280701 Archie
108 2018 LN8001041 Anubis
109 2018 LN895189 Kona
110 2018 LN728471 Nellie
111 2018 LNS103615 Louie
112 2018 LNS147321 Calhoun
113 2018 LNS147771 Juneau
114 2018 LN280772 Perry
115 2018 LNS113579 Boon
116 2017 LNS136307 Charlie
117 2018 LN84313 Gus
118 2018 LN8002192 Pixie
119 2017 LNS128681 Ella
120 2017 LN904131 Josie
121 2018 LNS106846 Maxfield
122 2018 LN950744 Maggie
123 2018 LNS145555 Kaneel
124 2017 LNS126795 Maya
125 2018 LNS144051 Fiona
126 2018 LN8004021 Leila
127 2017 LNS129084 Daxter
128 2018 LN8003295 Kilo
129 2017 LNS130406 Lucky
130 2018 LN8002603 Molly
131 2018 LN8001765 Chewy
132 2018 LNS121913 Coda
133 2018 LN138761 Pippin
134 2016 LN955781 Ziggy Sugar
135 2018 LNS101883 Chavo
136 2017 LN960176 Violet
137 2018 LNS145547 Faolan
138 2017 LN139602 Harper
139 2018 LNS117744 Genepi
140 2018 LNS126568 Lula Bell
141 2018 LN8000838 Larry
142 2016 LN955145 Harvey
143 2017 LN18358 Harrison
144 2018 LN283749 Chayse
145 2018 LN834709 Tanner
146 2018 LNS111725 Yeti
147 2017 LN280752 Gordy
148 2018 LNS141510 Laika
149 2017 LN130223 Rosie
150 2017 LN215894 Metabo
151 2017 LN84553 Rex
152 2017 LNS131549 Baxter
153 2018 LNS145226 Chloe
154 2017 LNS106564 Iggy
155 2018 LN8001156 Cleo
156 2018 LN8000922 Prince
157 2018 LNS132515 Juliette
158 2018 LN8003365 Shadow
159 2018 LNS121925 Jackson
160 2017 LNS129580 Keto
161 2018 LNS140577 Dexter
162 2018 LN581560 Ringo
163 2017 LNS133546 Barney
164 2018 LNS118288 Zeus
165 2018 LN136835 Cal
166 2018 LN217563 Murray
167 2017 LN216645 Gidget
168 2018 LNS132091 Clover
169 2018 LN901876 Derby
170 2018 LNS101667 Grommet
171 2018 LNS144968 Lexi
172 2018 LNS141946 Ruby
173 2017 LNS130860 Prim
174 2018 LNS141301 Charlie Chaplin
175 2017 LN960485 Phinney
176 2018 LN731319 Oscar
177 2018 LNS146603 Lucy
178 2018 LNS125611 Tommy
179 2018 LNS115630 Gustopher
180 2017 LN21452 Prince Uno
181 2018 LNS115304 Kona
182 2016 LNS125075 Marty
183 2018 LN216203 Digger
184 2018 LNS150163 Semmy
185 2016 LNS125630 Maya
186 2017 LN576558 Gage Louis
187 2017 LNS102238 Junie
188 2017 LN28068 Zoey
189 2018 LNS132225 Pippa
190 2018 LNS119905 Mamie
191 2017 LN959328 Conan
192 2017 LNS131269 Bixby
193 2017 LN361093 Smoky
194 2017 LNS123084 Jasmine
195 2018 LNS120840 Mustard
196 2018 LNS152199 Callie
197 2018 LN949761 Chrissie
198 2018 LN577820 Molly
199 2016 LN956876 Bella
200 2017 LN584186 Maple Syrup
201 2018 LNS131819 Willy
202 2017 LNS129475 Nyx
203 2018 LNS118889 Bubbles
204 2017 LNS102577 Abe
205 2017 LN833636 Mombi
206 2017 LNS107938 Mia
207 2017 LN349629 Orion
208 2017 LN79347322 Mr Darcy
209 2018 LN8000612 Rosie
210 2018 LN8003497 Oliver
211 2018 LNS139298 Milo
212 2018 LNS121342 Isabeau
213 2018 LN204863 Cinder
214 2018 LNS139573 Hoku
215 2018 LNS142885 Sydney
216 2018 LNS119479 Vera Neumann
217 2018 LNS133774 Poppy
218 2018 LNS104169 Mittens
219 2018 LNS114717 Ringa
220 2017 LNS132653 Louisette
221 2017 LN142766 Leon
222 2018 LNS123357 Pillow
223 2018 LNS110380 Akira
224 2018 LN824013 Connera
225 2017 LN73087 Fifille
226 2018 LN284621 Bingley
227 2018 LNS120839 Tootsie Roll
228 2018 LNS116397 Lily
229 2018 LN204824 Penelope
230 2015 LN573197 Sasha
231 2018 LNS142501 India
232 2018 LNS134424 Pi
233 2018 LNS152250 Lolo
234 2017 LN276755 Smilla
235 2018 LNS134465 Petrol
236 2017 LNS108576 Niera
237 2017 LNS126685 Kit
238 2017 LNS132852 Kitty
239 2018 LN140685 Martin
240 2018 LNS143981 Baker
241 2017 LN356678 Mongo
242 2018 LNS146099 Cosmo
243 2018 LNS117511 Buster
244 2017 LN210106 Jiro
245 2018 LN959549 Jiro
246 2016 LN275576 Gazelle
247 2018 LNS140378 Sam
248 2018 LNS140847 Maggie
249 2018 LN583980 Henri
250 2018 LNS139532 Hugo
251 2018 LNS137484 Biggie
252 2017 LN216906 Charlie
253 2017 LN80124 Shilo
254 2017 LNS138366 Nukka
255 2018 LNS122947 Seshen
256 2018 LN8000493 Indy
257 2018 LNS144670 Toby LeRone
258 2018 LNS114490 Snoqualmie
259 2017 LN725489 Mac
260 2018 LNS146871 Zara
261 2017 LNS127195 Wolverine
262 2018 LNS130502 Miss Hiss
263 2018 LNS134497 Charles
264 2018 LN83042 Tommy Girl
265 2017 LN141869 Chewbacca
266 2017 LNS129073 Brutus
267 2018 LN8000617 Joe
268 2018 LN8000267 Louie
269 2018 LNS130057 Robbie
270 2017 LNS101622 Emma
271 2018 LNS141862 Cobalt
272 2016 LN959935 Violet
273 2018 LNS139806 Jasmine
274 2018 LN727922 Luna Nero
275 2018 LN585912 Remy
276 2018 LNS125855 Rita
277 2017 LNS130298 Zamboni
278 2018 LNS144979 Daisy
279 2018 LNS140262 Lily
280 2018 LN830694 Frankie
281 2017 LNS107648 Miss Ellie
282 2018 LNS131385 Pip
283 2017 LNS132087 Foz
284 2018 LNS128673 Bo
285 2018 LN8004134 Maggie
286 2018 LN731849 Bobo
287 2018 LN828535 DInah
288 2017 LN216673 Toby
289 2017 LNS107797 Bluebell
290 2018 LN216214 Rhuben
291 2018 LN8000160 Indigo
292 2018 LNS141522 Melba
293 2017 LNS108363 Agnes
294 2018 LNS145857 Pippa
295 2017 LNS136434 Jasper
296 2017 LNS109835 Josie
297 2018 LNS107336 Sadie
298 2018 LNS115383 Goldie
299 2018 LN8001665 "Luci" Lucia Rosalin Wicksugal
300 2018 LN140591 Diggy
301 2018 LN202110 Duffy
302 2017 LNS102215 King
303 2017 LNS137022 Poppy
304 2016 LNS119369 Scout
305 2017 LN139742 Spike
306 2018 LNS128676 Miles
307 2018 LN80484 Samwise
308 2018 LN725333 Nina
309 2018 LNS123620 Triumph Buras
310 2017 LN444138 Gemma
311 2017 LNS140567 Darla
312 2018 LNS139342 Finnegan
313 2017 LNS138201 Dewey
314 2018 LNS102688 Mac
315 2018 LN355473 Lola
316 2018 LNS142485 Sandy
317 2018 LNS145538 Nellie
318 2017 LNS133820 Gretchen
319 2017 LN280582 Moby
320 2017 LNS136366 Trixie
321 2018 LN8000609 Elly
322 2018 LNS140776 Mitzy
323 2018 LNS146788 Penny
324 2018 LNS141883 Leo
325 2018 LNS142628 Grumpy
326 2017 LN217828 Luna
327 2017 LN349147 Linky
328 2017 LN276629 Pogo
329 2017 LNS107627 Hoshi
330 2018 LNS104107 Minnow
331 2018 LN8004006 Zippy
332 2017 LN123147 Harley
333 2017 LN353161 Knives
334 2017 LN85533 Flash
335 2018 LN83503 Myron
336 2018 LNS142080 Andante
337 2017 LN142544 Nala
338 2018 LNS134426 Dolce
339 2018 LN732462 Benjamin
340 2018 LNS104167 Leo
341 2018 LN833754 Charlie
342 2018 LN896687 Minka
343 2018 LNS100819 Sasha
344 2017 LNS104898 Louis
345 2018 LNS134429 Chandra
346 2018 LNS146492 Thomas
347 2018 LN832550 Ollie
348 2018 LNS139262 Azula
349 2018 LN586309 Snuffles
350 2018 LN273668 Sammy
351 2018 LN273487 Oliver
352 2018 LN434892 Sammi
353 2018 LN282940 Lucy
354 2018 LNS142227 Margot
355 2016 LN82266 Gwen
356 2015 LN560448 Lou
357 2018 LN730949 Cassie
358 2018 LNS130834 Jager
359 2018 LNS131348 Sam
360 2017 LN80904 Cowboy
361 2018 LNS124117 Suzy Q
362 2016 LNS101088 Raphael
363 2018 LNS118149 Dinko
364 2018 LNS141106 Jake
365 2018 LNS146565 Cedar
366 2017 LNS131146 Kaehu
367 2017 LN359737 Millie
368 2018 LNS113638 Dobbie
369 2017 LN86226 Abbey
370 2018 LNS123011 Sandy
371 2018 LN961032 Labowski
372 2017 LNS135983 Jasper
373 2018 LN581864 Sampagita
374 2016 LNS123991 Dragon
375 2018 LNS142137 Penny
376 2018 LNS144134 Cassie
377 2018 LN140041 Chloe
378 2018 LNS146053 Dude
379 2018 LNS119504 Juno
380 2017 LN211206 Gracie
381 2018 LN29770 Logan
382 2018 LNS139892 Baxter
383 2017 LN821150 Macho
384 2017 LNS129433 Ferdinand
385 2017 LN580657 Jensina
386 2018 LNS144151 Joey
387 2018 LN8002945 Ginger
388 2018 LNS139193 Benny
389 2017 LNS139176 Jack
390 2016 LNS125955 Josie
391 2018 LN723787 Spud
392 2018 LN730950 Lilly
393 2018 LN8002975 Jackson
394 2018 LN8003923 Eva
395 2018 LN730678 Saru
396 2018 LN8003170 Mia
397 2018 LNS144012 Keibi
398 2017 LN442650 Madison
399 2017 LN30073 Maya
400 2017 LN358386 Maia
401 2018 LNS118011 Yoda
402 2018 LN731728 Jackson
403 2018 LNS150179 Hammy
404 2017 LN583649 Fry
405 2018 LNS144694 Angel
406 2018 LN138666 Heidi
407 2018 LN433036 Klaus
408 2017 LNS104062 Lucy
409 2018 LN142286 Barney
410 2018 LN732825 Woody
411 2018 LN8003137 Valentine
412 2017 LN204884 Nod
413 2018 LN208443 Mitzi
414 2018 LNS101014 Smokey
415 2018 LN71467 Missy
416 2017 LNS108054 Opal
417 2017 LNS107151 Scarlett
418 2018 LN8003950 Herdy
419 2018 LNS142194 Sam
420 2018 LNS146648 Sabrino
421 2018 LNS140912 Shark
422 2018 LNS144346 Henry
423 2018 LNS139759 Smokey
424 2018 LNS100828 Bitsy
425 2018 LN138601 Buddy
426 2018 LNS140638 Goose
427 2018 LNS134098 Finley
428 2018 LNS145197 Oslo
429 2017 LN584502 Bambu
430 2018 LN831877 Bandit
431 2018 LNS142182 Tucker
432 2017 LNS138711 Jam
433 2017 LN214814 Hank
434 2017 LN216783 Zeus
435 2018 LNS139254 Isabel
436 2017 LNS126063 Tukey
437 2018 LNS113166 Snuzzy
438 2018 LN82485 Tilly
439 2018 LNS141320 Theo Renshaw
440 2018 LN901063 Lucy
441 2018 LN8001879 Leonardo Jino Kirr
442 2017 LNS106240 Rush
443 2017 LN958064 AJ
444 2018 LN8003750 Arizona
445 2017 LN444568 Wilson
446 2018 LNS117054 Hank
447 2018 LNS120866 Thor
448 2018 LNS143524 Shrimp
449 2018 LNS129425 Maximus
450 2017 LN141524 Luna
451 2017 LN209512 Lucy
452 2018 LNS139508 Jo
453 2017 LNS135400 Sally
454 2016 LNS139214 Ernie
455 2018 LN8002753 Luna
456 2017 LN25621 Zelda
457 2018 LNS130943 Cooper
458 2018 LNS114050 Pepper
459 2018 LNS118590 Griffey
460 2018 LNS123574 Toto
461 2017 LNS132216 Sesame
462 2018 LN212175 Baylee
463 2018 LNS111013 Pickles
464 2018 LN8002254 Patrick
465 2018 LN138361 Jazz
466 2017 LN901598 Kenzel
467 2018 LNS120641 Penny
468 2018 LNS145251 Birdie
469 2018 LN24123 Simon
470 2018 LNS120123 Snoopy
471 2018 LNS143079 Leo
472 2018 LNS125116 Fionn
473 2018 LNS146814 Ziggy
474 2018 LNS144783 Bessie
475 2018 LNS141986 Little Miss Dublin Maeve of the Emerald Isle
476 2018 LN719947 Abbey
477 2018 LNS120426 Philip
478 2017 LNS104767 Annie
479 2017 LN279960 Jet
480 2018 LN444285 Gunnar
481 2017 LNS122744 Daisy
482 2018 LNS135478 Kato
483 2017 LNS130453 Penny
484 2017 LN583366 Chance
485 2017 LN731694 Olivia
486 2018 LN8001152 Nyah
487 2018 LNS134133 Boomer
488 2018 LN891265 Quattro
489 2018 LN579094 Toby
490 2018 LNS143534 Apollo
491 2018 LNS120387 Maude
492 2017 LNS130725 Harvey
493 2017 LN732660 Girl Scout
494 2017 LNS127911 Kudo
495 2018 LNS119030 Pepper Anne
496 2018 LN8001098 Coya
497 2018 LN952469 Ella
498 2018 LNS121881 Sushi
499 2018 LN129573 Sweet Pea
500 2018 LNS145124 Puzzles
501 2017 LN350351 Lalla
502 2018 LN19197 Rosie
503 2018 LNS145951 Moonbeam
504 2017 LN133432 Cody
505 2017 LN832705 Sweet Anna
506 2018 LNS152189 Ara
507 2018 LNS112866 Chip
508 2017 LN202885 Luca
509 2018 LNS117480 Enzo
510 2018 LNS145312 Moose
511 2018 LN8001871 Zulu
512 2017 LN136322 Tre
513 2018 LN959919 Kilkenny
514 2018 LNS117908 Addy
515 2016 LN79023 Marley
516 2017 LN141578 Penny
517 2018 LNS149194 Oden
518 2018 LN443161 Stockholm
519 2018 LNS133847 Patronus
520 2018 LN27857 Harley
521 2018 LNS139287 The Drake
522 2018 LNS139063 Kenya
523 2018 LNS127335 McKenna
524 2018 LNS131014 Quica
525 2018 LN279935 Molokai
526 2018 LNS140775 Poppy
527 2018 LNS140471 Ipo
528 2018 LNS126940 Sam
529 2017 LN141879 Dozer
530 2018 LN444790 Otello
531 2017 LNS131461 Gracie
532 2018 LNS141035 Teddy (Theodore)
533 2018 LN572064 Biscuit
534 2017 LN961158 Marcia
535 2018 LN28054 Amy
536 2017 LNS127887 Pinkie
537 2018 LN83418 Franklin
538 2017 LN85135 Cortado
539 2018 LN351016 Blaze
540 2018 LN8001282 Sassy
541 2018 LN8002526 Leia
542 2018 LN431030 Ming
543 2017 LN586637 Wiley
544 2018 LNS122246 Jynx
545 2018 LN8002705 Ooma
546 2018 LNS143155 Henry
547 2018 LNS113053 Kita
548 2018 LN8003592 Torta
549 2018 LNS109251 Tasi
550 2018 LNS149106 Berlin
551 2017 LNS135226 Lucas
552 2018 LN8002478 Kevin Hart
553 2018 LNS120319 Darby
554 2018 LNS144759 Tyson
555 2017 LN80918 Chloe
556 2018 LNS147525 Toby
557 2018 LNS134992 Ari
558 2018 LN138098 Coconut
559 2018 LNS141118 Lili Marleen
560 2018 LNS121810 Hoot
561 2018 LNS136105 Hobbes
562 2018 LN8001587 Leia
563 2018 LNS128030 Blu
564 2017 LNS136972 Eustice
565 2018 LNS125834 Gaston
566 2017 LNS131178 Tashi
567 2018 LNS130316 Emma Ganin
568 2018 LN212098 PJ
569 2017 LNS135661 Kiddo
570 2018 LN8000582 Rocky
571 2018 LN8003864 Zoey
572 2018 LNS135304 Lucy
573 2017 LNS118664 Bosco
574 2018 LN8000889 Hoku
575 2018 LNS129647 Gigi
576 2016 LNS125989 Charlie
577 2018 LNS124172 Haru
578 2018 LN138642 Kate
579 2017 LN139632 Beemo
580 2018 LN898799 Beckett
581 2017 LN436868 Chumba Bear
582 2018 LNS106023 Oliver
583 2017 LNS130922 Tato
584 2017 LNS103628 Doctor Evil
585 2017 LN832944 Maeby
586 2018 LNS140877 Chula
587 2018 LN434564 Roxie
588 2017 LN29145 Ugnaught
589 2017 LNS103715 Rocket
590 2018 LNS140777 Bella
591 2017 LN133602 Dita
592 2017 LNS134670 Ash
593 2018 LNS142571 Cronut
594 2018 LNS123704 Ollie
595 2018 LNS149214 Cider
596 2017 LNS128375 Tommy T
597 2016 LN15183 Pindar
598 2017 LN732097 Callie
599 2017 LNS127187 Carson
600 2018 LNS143695 Tofu
601 2018 LNS131780 Rasa
602 2018 LNS120280 B&W
603 2018 LNS146537 Sneezy
604 2018 LNS147010 Bentley
605 2018 LN716305 Cowboy
606 2017 LNS138266 Crater
607 2018 LNS138649 BusterBear
608 2018 LN8000107 Baxter
609 2017 LN900896 Oliver
610 2018 LN835204 Madison
611 2018 LNS114684 Tinkerbelle
612 2018 LNS143316 Arlo
613 2017 LN137583 Sadie
614 2017 LNS132012 Tazman
615 2018 LNS111756 Pepper Potts
616 2018 LN349247 Hana
617 2018 LNS145127 Edgar
618 2017 LN444408 Gabi
619 2017 LN84172 Teddy
620 2017 LN831830 Lucky
621 2018 LN8000239 Pablo Lowery
622 2018 LN8002379 Luna
623 2017 LNS107842 Lucky
624 2017 LN141248 Buster
625 2018 LN78157 Franny
626 2017 LN84608 Shaka
627 2018 LN80008 Frank
628 2018 LNS136964 Ri
629 2018 LNS142073 Annie
630 2018 LNS116788 Jake
631 2018 LN8003269 Jones
632 2017 LNS126893 Rory
633 2017 LNS102538 Hailey
634 2017 LN211075 Pippin
635 2017 LN585071 Lulabelle
636 2018 LN584796 June Bug
637 2018 LNS134031 Bishop
638 2017 LNS128088 Kylie
639 2017 LN435837 Cindy Lou
640 2018 LN141142 Maisie
641 2018 LN206544 Raven
642 2018 LN731510 Kafi
643 2018 LNS135255 Chloe
644 2015 LN585641 Trout
645 2017 LN579562 Campbell
646 2018 LNS142284 Mustafa
647 2018 LN428266 Eliza
648 2018 LNS118997 Nova
649 2018 LNS142415 Sophie
650 2017 LNS136540 Leeloo
651 2018 LN8002037 Sebben
652 2018 LNS141592 Georgie
653 2018 LN8002040 Marley
654 2018 LNS134539 Garfield
655 2018 LNS134461 OJ
656 2018 LN204738 Hunter
657 2017 LN430537 Skeletor
658 2018 LN964240 Griffey
659 2017 LNS104264 Posey
660 2017 LN433410 Himhe
661 2018 LNS101685 Juno
662 2018 LN833257 Badger
663 2018 LN733011 Misha
664 2017 LNS127772 Sampson (Prince Charming)
665 2018 LN68092 Emma
666 2018 LN732275 Inky
667 2016 LN953254 Benny
668 2018 LNS146501 Mack (Frankie)
669 2017 LN351208 Tommy
670 2016 LN962338 Josie
671 2017 LNS136324 Theadora
672 2018 LNS116352 Sucha
673 2017 LN284885 Sophie
674 2018 LNS125565 Atari
675 2018 LN892002 Jellie
676 2018 LN74399 Tiger
677 2018 LNS140267 Balam
678 2018 LN26352 Frankie
679 2018 LN139672 Coco Rose
680 2018 LNS143784 Otto
681 2018 LNS141672 Luna
682 2017 LNS108114 Tripp
683 2018 LNS134843 Harvey
684 2017 LN580847 Jasper
685 2017 LN951162 Pesto
686 2018 LNS145387 Maddie
687 2018 LN84405 No Show
688 2017 LN64346 Sara
689 2018 LN8001357 Baie
690 2018 LNS143992 Cedra
691 2017 LN580774 Kona
692 2018 LNS121687 Mazie
693 2018 LNS147294 Lun
694 2017 LN29777 Simba
695 2018 LNS127767 Coconut
696 2017 LN139452 Daisy
697 2016 LNS125044 Gabby
698 2018 LN904872 Poppy
699 2018 LNS130430 Dobby
700 2018 LN141131 Addie
701 2018 LNS137807 Chauncey
702 2018 LN432886 Butters
703 2017 LNS137275 Molly
704 2018 LN359251 Sophocles
705 2018 LN576065 Rocky
706 2017 LNS131032 Bella
707 2018 LNS133558 Ruger
708 2018 LNS140793 Bowser
709 2018 LNS143502 Solo
710 2018 LN358160 Betty
711 2018 LNS132369 Oliver
712 2018 LNS146076 Stuart
713 2017 LN81345 Oscar
714 2018 LN904638 Dexter
715 2018 LN585535 Mr.Big
716 2018 LNS144673 Sofie
717 2017 LN831007 Fred
718 2018 LN8001915 Lucy
719 2018 LN729264 Tater
720 2018 LN903527 Ace
721 2018 LN26004 Remy
722 2018 LN76506 Stormy
723 2018 LN281496 Dennis Bergkamp
724 2018 LNS141921 Harriet
725 2017 LN830795 Tucker
726 2018 LN902328 Hook
727 2016 LNS119565 Coco
728 2018 LNS145996 Bella
729 2018 LN276475 Tara
730 2017 LNS101228 Azi
731 2018 LN8001029 Gustav
732 2018 LNS137363 Waffles
733 2018 LNS127354 Umi
734 2018 LNS127962 Stella
735 2017 LNS131285 Rosie
736 2018 LNS111552 Maizie
737 2018 LNS119358 Kali
738 2018 LNS139875 Kai
739 2018 LN134402 Arlo
740 2018 LNS124530 Frankie
741 2018 LN8001399 Asher
742 2016 LN207943 Bandit
743 2018 LN443123 Hugo
744 2018 LN440988 Pepper
745 2018 LN138768 Mabel
746 2018 LN572070 Carmela
747 2018 LNS144467 Susi
748 2018 LN358863 Bruce
749 2017 LN585478 Huckle Bear
750 2018 LNS141623 Mabel Grace
751 2018 LN903454 Sparrow
752 2017 LNS105765 Bunny
753 2018 LN729618 Nola
754 2018 LN583492 Scout
755 2017 LNS135676 Hazel Moon
756 2017 LNS134783 Qince
757 2018 LN439678 Allie
758 2018 LNS119574 Dante
759 2018 LNS140614 Kiyah
760 2018 LN439603 Oso
761 2017 LN354866 Archie
762 2018 LNS101276 Zorro
763 2018 LN827493 Gracie
764 2018 LNS105198 River
765 2017 LN140883 Bob
766 2018 LNS118347 Winston
767 2018 LN8004246 Olive
768 2017 LN901159 Brio
769 2018 LNS149120 Bentley
770 2018 LNS116512 Nutmeg
771 2018 LN77277 Shane
772 2018 LNS101629 Johnny Castle
773 2018 LNS111247 Tobias
774 2017 LNS133907 Dusky
775 2018 LN732547 Puma
776 2017 LNS125395 Kimi
777 2018 LNS139928 Buddy
778 2018 LNS140149 Xena
779 2018 LNS146611 Kitty
780 2018 LN22140 Lucy
781 2016 LNS122885 Cheese
782 2017 LN140292 Ravenna
783 2018 LN8003031 Lemon
784 2017 LN269259 Maggie
785 2018 LNS140883 Mango
786 2018 LNS139664 Salma
787 2018 LNS147133 Sassafras (Sassy)
788 2017 LN715482 Cookie
789 2018 LNS139475 Lizzy
790 2017 LN833254 Darling
791 2018 LNS123952 Totoro
792 2017 LN22576 Amy
793 2018 LN74373 Max
794 2018 LN77172 Yuki
795 2017 LNS100750 Lily
796 2017 LN574170 Mahlda
797 2018 LNS144341 Garfield
798 2017 LNS138475 Josephine
799 2018 LN732446 Sunshine
800 2018 LN75132 Diva
801 2017 LN569669 Mimi
802 2017 LN964823 Maggie
803 2017 LN351058 Penelope
804 2018 LN72725 Maeve
805 2018 LNS119044 Mel
806 2017 LN584560 Bastas
807 2018 LNS119705 Eddie
808 2018 LN8000109 Mama Mia
809 2017 LN22283 Tammy
810 2017 LN730995 Gypsy Rose
811 2018 LNS104413 Tinkerbelle
812 2018 LNS146665 Mr. Darcy
813 2018 LN830865 Honey Girl
814 2018 LNS134568 Zeus
815 2017 LNS134320 Pie
816 2018 LN573064 Keaton
817 2017 LNS134627 Gelato
818 2017 LN954140 Nathan
819 2018 LNS115148 Lorelai
820 2018 LN585271 Chauncey
821 2018 LNS133068 Dale
822 2018 LN728602 Albie
823 2018 LNS147769 Remy
824 2017 LN359941 Lilly
825 2018 LN281569 Stella Luna
826 2018 LNS140345 Mollie
827 2017 LNS105577 Marcus
828 2018 LNS139345 Thurston
829 2018 LN732804 Ginger
830 2018 LN82730 Pow
831 2017 LN356803 Beckett
832 2018 LNS129825 Oswald
833 2018 LNS121347 Stella
834 2017 LN439530 Bella
835 2018 LNS137495 Flash
836 2018 LNS130426 Tonka
837 2018 LNS144642 Bailey
838 2018 LNS142173 Olive
839 2018 LNS144917 Devery
840 2018 LN8002725 Scully
841 2018 LNS143544 Stella
842 2018 LN904348 Piper
843 2017 LN214162 Duke
844 2018 LN439689 Betty Davis
845 2018 LN216381 Milo
846 2018 LN141947 Olive
847 2018 LN733149 Lenny
848 2018 LN8001927 Xavier
849 2018 LN216420 Abby
850 2018 LN207448 Angel
851 2017 LNS131518 Griffin
852 2018 LN26196 Fishin Larson
853 2018 LNS106869 Nelly
854 2018 LNS131540 Dakota
855 2018 LNS144749 Ivan
856 2017 LNS106238 Lilly
857 2018 LN8004219 Finley
858 2017 LN23616 Mia
859 2017 LN577432 Oliver
860 2018 LN213921 Bella
861 2018 LNS137559 Blair
862 2017 LNS103330 Frankie
863 2018 LN210509 Bella
864 2017 LNS103085 Nellie
865 2018 LNS118410 Kuma
866 2018 LNS135727 Stanley
867 2018 LNS122445 Jackson
868 2018 LNS112167 Oliver
869 2017 LNS106914 Buddy
870 2018 LNS141607 Gizmo
871 2018 LN8003376 Lucy
872 2017 LNS134138 Otis
873 2016 LNS115690 Hoover
874 2017 LN142403 Sparky
875 2017 LN731676 Bear
876 2018 LN8002685 Oscar
877 2018 LN142174 Lil
878 2018 LNS109825 Bentley
879 2018 LNS117732 Luca
880 2017 LN825789 Molly
881 2017 LN282747 Luna
882 2018 LN8002773 Tallulah
883 2017 LNS135244 Hannah
884 2018 LNS151122 Gypsy
885 2018 LNS149205 Tate
886 2017 LN724228 Django
887 2018 LNS111554 Draven
888 2018 LNS110194 Lucy
889 2018 LN574009 Venice
890 2018 LN353430 Pho
891 2017 LN724212 Ella
892 2017 LN568099 Petula
893 2018 LN215249 Ashley
894 2018 LN897143 Trina
895 2017 LN586586 Fyn
896 2018 LNS149204 Skyy
897 2018 LNS141990 Ramon
898 2018 LN733206 Clarisse
899 2017 LN824358 Franz
900 2018 LN721507 Luna
901 2018 LN268258 Zoey
902 2018 LNS144976 Luke
903 2018 LNS114573 Bella
904 2017 LNS127862 Moby
905 2018 LN273708 Atlas
906 2017 LN893665 Sophie
907 2018 LN574314 Little Kitty
908 2017 LNS106218 Lodi
909 2017 LNS102122 Sweetie
910 2018 LN128319 Sadie
911 2018 LN8004163 Jinx
912 2017 LNS102822 Luke
913 2018 LNS143667 BC II
914 2018 LN724558 Garrison
915 2018 LN730971 Lucy
916 2018 LNS151161 Blondie
917 2018 LNS144793 Daisy
918 2017 LN278036 Macy
919 2018 LN8002358 Duck
920 2018 LNS147432 Prissy
921 2018 LNS151136 Bix
922 2018 LNS131083 Ella
923 2018 LN8004151 Skittles
924 2018 LNS117605 Mochi
925 2018 LNS145798 Walter
926 2017 LN66177 Cassie
927 2018 LNS145024 Dagmar
928 2018 LNS115254 Clover
929 2017 LNS124714 Remy
930 2018 LN833442 Jwl
931 2017 LN83672 Bode
932 2017 LNS123149 Dawson
933 2018 LNS147073 Kipa Ponce de Leon Bowers
934 2018 LNS140546 Emmy
935 2018 LN725140 Faith
936 2018 LNS144287 Buddy
937 2018 LN212625 Hailey
938 2017 LN444943 Milo
939 2017 LN831931 Baxter
940 2018 LN202002 Dilly
941 2017 LN359760 Otis
942 2018 LN901755 Mabel Joy
943 2018 LNS121796 Emily
944 2018 LN900893 Pippin
945 2018 LN8001822 Mocha
946 2018 LNS129506 Buddy
947 2018 LN834814 Bella
948 2017 LN24638 Jaxon
949 2017 LNS104897 Sophie
950 2017 LN24287 Roxy
951 2018 LNS128619 Donner
952 2017 LNS138445 Jack
953 2017 LN577326 Soleil
954 2018 LN8000850 Odin
955 2018 LN84026 Tikka Bear
956 2018 LN281815 Polo
957 2018 LN358791 Maya
958 2018 LNS111406 Jamison
959 2017 LN898875 Rupert
960 2018 LNS121088 Marilyn
961 2018 LNS105536 Yogi Bingman
962 2018 LNS122764 Georgia
963 2017 LN216781 Madison
964 2017 LN214096 Pashka
965 2018 LNS146720 Logan
966 2018 LN903342 Joey
967 2018 LN84139 Carly Rose
968 2018 LN279463 Lily
969 2017 LN902810 Otto
970 2017 LN444581 Tuli
971 2018 LNS146615 Gavy
972 2017 LN214684 Sunny
973 2018 LN829696 Lilo
974 2017 LNS135365 Joey
975 2018 LN8002347 Rocco
976 2018 LNS143086 Mia
977 2018 LNS143272 Tod
978 2018 LN214747 Chilly
979 2018 LN959601 Miles
980 2018 LNS145381 Zelda
981 2015 LN898151 Lucky
982 2018 LNS109337 Sweetpea
983 2016 LN142980 Bootsy
984 2018 LN726564 Plumpy
985 2017 LN142899 Riley
986 2017 LN584861 Logan
987 2018 LNS146641 Stevie Nicks
988 2018 LNS145230 Olive
989 2017 LNS138552 Cookie
990 2017 LN213283 Mbali
991 2018 LN217815 Maggie
992 2018 LNS145451 Zaiya
993 2018 LNS124786 Oliver
994 2018 LNS110233 Lucy
995 2018 LNS124525 Enzo
996 2018 LNS121030 Simba
997 2018 LNS128655 Echo
998 2017 LN130219 Hershey
999 2017 LN206942 Pearl
1000 2018 LNS127243 Max
1001 2017 LNS127623 Izzy
1002 2018 LN359134 Tux
1003 2017 LNS132218 Jack
1004 2018 LNS145155 Ella
1005 2018 LN828539 Luna
1006 2017 LN904891 Juno
1007 2018 LNS113432 Bane
1008 2018 LN961231 Bugsy
1009 2018 LNS116761 Phoebe
1010 2018 LNS145214 Bo
1011 2018 LN962062 Honey
1012 2018 LNS117431 Ava
1013 2018 LN431887 Kodiak
1014 2017 LN444472 Percy
1015 2018 LN23239 Barney
1016 2017 LN731173 Jaro
1017 2018 LN443536 Teddy
1018 2018 LNS131627 Arlo
1019 2017 LN438883 Willow
1020 2018 LN131763 Miss Moneypenny 'Penny'
1021 2018 LNS145797 Olaf
1022 2017 LN86157 Rylee
1023 2018 LNS144340 Rainier
1024 2018 LN8004136 Sophie
1025 2018 LNS100238 Ozzie
1026 2017 LN830322 Pia
1027 2018 LNS143893 Julep
1028 2018 LNS146551 Domino
1029 2018 LNS143449 Petey
1030 2018 LN583155 Sixer
1031 2018 LNS139301 Marshall
1032 2017 LNS100507 Daisy
1033 2017 LN731879 Blitz
1034 2017 LN731001 Daisy
1035 2017 LNS132061 Finn
1036 2018 LNS143089 Ezri Dax
1037 2017 LNS126194 Mabel
1038 2018 LN8000951 Wynnie
1039 2018 LN442091 Charlie Tuxedo
1040 2018 LNS117980 Tortie
1041 2018 LN83415 Luna
1042 2018 LNS142619 Athena
1043 2018 LNS116835 Billi Sinni-Sappa
1044 2017 LN209295 Shadow
1045 2018 LN8003501 Oscar
1046 2018 LNS105760 Captain Jack
1047 2017 LN19097 Lolly
1048 2017 LN276594 Joey
1049 2018 LN83259 Watson
1050 2017 LNS105373 Charlie
1051 2018 LN8000016 Inky Jinx
1052 2018 LNS146954 Katy
1053 2018 LN434547 Benny
1054 2017 LN443725 Rocco
1055 2017 LN948374 Bailey
1056 2018 LN273197 Ginny
1057 2018 LN350900 Nika
1058 2018 LN732074 Murray
1059 2017 LN204349 Misty
1060 2017 LN361363 Checkers
1061 2018 LNS137894 Elsa
1062 2017 LN352205 Quincy
1063 2017 LN892108 Wyken
1064 2017 LN817919 Gilda
1065 2017 LNS131439 Zeke
1066 2017 LNS100648 Quincy
1067 2018 LN824689 Eammon
1068 2017 LN282431 Meredith
1069 2018 LN77103 Zola
1070 2018 LN570929 Sophia
1071 2018 LNS143292 Ambrosia
1072 2018 LNS124236 Elise
1073 2017 LNS103519 Big Suze
1074 2018 LN8004018 Mew
1075 2017 LN344900 Sasha
1076 2017 LN825175 Tarball
1077 2017 LN952401 Gus
1078 2018 LN273623 Sally
1079 2017 LN203385 Jilly
1080 2018 LN204771 Quincy
1081 2018 LN429481 George
1082 2018 LN83326 Sassy
1083 2018 LN8001722 Princess
1084 2018 LN215540 Splash
1085 2018 LN832332 Marv
1086 2018 LN833538 George
1087 2018 LNS110281 Arbor
1088 2018 LNS121308 Daisy
1089 2017 LN84357 Murphy
1090 2018 LN8001227 Comey Roginski
1091 2017 LNS134097 Sissy
1092 2018 LN961532 Tsuki
1093 2018 LNS140431 Leeloo Dallas
1094 2018 LNS148150 Jasper
1095 2018 LN8001353 Luke
1096 2018 LN283995 Simba
1097 2018 LNS122739 Remy
1098 2018 LNS121554 Remington
1099 2018 LN84655 Polly
1100 2018 LNS137602 Summer
1101 2017 LN76796 Scrappy
1102 2018 LN8002748 Leeloo
1103 2017 LNS125196 Rocco
1104 2018 LNS116045 Maggie
1105 2017 LN832988 Trek
1106 2018 LNS116227 Junee
1107 2018 LN957433 Dogg
1108 2018 LN8002669 Emma
1109 2018 LNS120907 Otter
1110 2018 LNS101580 Roco/Rambo (Angel)
1111 2018 LN900902 Greta
1112 2018 LNS144334 Leela
1113 2018 LNS146893 London
1114 2017 LN581835 Percy
1115 2018 LNS143762 Pogo
1116 2017 LN444841 Jasper
1117 2018 LN136917 Bette
1118 2018 LNS144855 Paisley
1119 2018 LN8000290 Zadie Bobo
1120 2018 LN899581 Brewster
1121 2017 LNS118693 Odie
1122 2017 LN81404 Tomas
1123 2018 LNS144485 Samantha
1124 2017 LNS138462 Chug
1125 2018 LNS139004 Bourbon
1126 2017 LNS139134 Claire
1127 2018 LNS144022 Mumford
1128 2017 LNS135021 Baxter
1129 2018 LN725428 Dolly
1130 2018 LN277463 Shayla
1131 2016 LN82058 Jake Garron
1132 2017 LNS142390 Custard
1133 2017 LN278825 Sadie
1134 2018 LNS101568 Princess
1135 2017 LN278807 Boomer
1136 2017 LN425685 Max
1137 2017 LNS139143 Bosco
1138 2018 LNS140243 La Vie
1139 2018 LNS128832 Patience
1140 2018 LN135242 Rain
1141 2018 LNS142890 Violet
1142 2017 LNS131376 Henry
1143 2017 LNS101924 Potato
1144 2018 LN443054 Livia
1145 2018 LN215632 Hallie
1146 2018 LN962812 Bechay
1147 2018 LNS116882 Moxie
1148 2018 LNS144096 Boris
1149 2018 LNS130479 Rafe
1150 2017 LN141747 Nell
1151 2018 LNS101900 Liela
1152 2018 LNS145549 Indie
1153 2017 LN827302 Lulu 2
1154 2018 LNS147293 Rue
1155 2017 LN356426 Dan
1156 2018 LNS101520 Caliie
1157 2017 LN582285 Captain
1158 2018 LNS120365 Simba
1159 2018 LNS113413 Rex
1160 2017 LN828788 Eddie Megatron
1161 2018 LNS135952 Batboy
1162 2018 LN824428 Pantalaimon
1163 2016 LN28750 Benjamin
1164 2018 LN952139 Abigail
1165 2016 LN22352 Brooklyn
1166 2016 LNS101501 Buddy
1167 2018 LNS142385 Max
1168 2017 LN140148 Jasmine
1169 2017 LN346530 Louis
1170 2017 LN952843 Egypt
1171 2018 LN22645 Baby
1172 2017 LNS131431 Cookie
1173 2017 LNS134352 Miss Fluffy
1174 2018 LN578767 Peej
1175 2018 LNS144537 Freckles
1176 2018 LNS118414 Zosia
1177 2017 LN273888 Samuel
1178 2018 LN445421 Linux
1179 2018 LNS140258 Adam West Bakenhus
1180 2018 LN198647 Patter
1181 2017 LNS139149 K.T.
1182 2018 LNS142095 Motor
1183 2017 LN29162 Martok
1184 2017 LNS138047 Jake
1185 2018 LNS143234 Bella
1186 2017 LNS135557 Princess Daisy
1187 2017 LNS139045 Gatsby
1188 2018 LNS134978 Merle
1189 2015 LN962407 Shadow
1190 2017 LNS138501 Koda
1191 2018 LNS106177 Chloe
1192 2018 LN206951 Molly
1193 2018 LN828789 Milo
1194 2018 LNS141721 Chester
1195 2018 LNS144842 Tj
1196 2018 LN360482 Winston
1197 2018 LNS103770 Oso
1198 2017 LN139734 Edison
1199 2018 LNS143063 Chloe
1200 2018 LNS140460 Juneo
1201 2017 LN82723 Meto
1202 2017 LN444447 Goose
1203 2018 LN830584 Sonic
1204 2018 LNS143166 Atlas
1205 2018 LNS148201 Artie
1206 2018 LNS145640 Maggie
1207 2018 LN440706 Cookie
1208 2017 LN441081 Wafer
1209 2018 LNS141829 Giovanna
1210 2018 LN729657 Ruby
1211 2017 LNS137737 Rosie
1212 2017 LN584975 Selah
1213 2017 LNS104754 Lilly
1214 2017 LN25905 Bella
1215 2017 LN216874 Howie
1216 2018 LNS138180 Maxx
1217 2017 LNS137738 Norm
1218 2018 LN360330 Daisy
1219 2017 LN280767 Gunther
1220 2018 LN444762 Katja Levy
1221 2018 LNS145441 June
1222 2018 LNS115852 Ricky
1223 2016 LN579243 Chunk
1224 2018 LNS141870 Chief
1225 2018 LN216898 Gemma
1226 2018 LNS110236 Jelly Beans
1227 2018 LNS137471 Peanut
1228 2018 LNS142159 Oscar
1229 2017 LN139708 Axl
1230 2018 LNS144308 Benjamin
1231 2017 LN358704 Maple
1232 2018 LNS144198 Princess Pristique
1233 2017 LN957205 Bridget
1234 2017 LNS138650 Stella
1235 2018 LNS145615 Sparky
1236 2018 LNS112227 Penny
1237 2018 LNS145631 Gunner
1238 2018 LN831761 Simba
1239 2018 LNS103321 Toby
1240 2018 LNS152173 Kobe
1241 2018 LNS139462 Lucy
1242 2017 LN833221 Ruby
1243 2017 LN142494 Vasilisa
1244 2018 LNS146510 Milo
1245 2018 LN133437 Jada Pinkett
1246 2018 LN439640 Roxy
1247 2017 LN28758 Hakusen
1248 2018 LNS146465 Daniel Tiger
1249 2018 LNS134416 Fenn
1250 2018 LNS139708 Hiro
1251 2017 LN578976 Giorgio
1252 2017 LN28170 Diabl
1253 2017 LN430997 Lucy
1254 2018 LN430357 Frida
1255 2018 LNS142979 La Puma
1256 2018 LN140438 Yeti
1257 2017 LN345808 Eve
1258 2017 LN268276 Murray
1259 2018 LNS139782 Spongecake
1260 2017 LN142118 Teasel
1261 2018 LNS132843 Gennie
1262 2018 LNS146095 Kuromame
1263 2018 LN282458 Clover Pixie
1264 2017 LN586826 Denali
1265 2018 LNS124829 Smaug
1266 2018 LN822992 Yuni
1267 2017 LNS130485 Poppy
1268 2015 LN9599 Ridley
1269 2018 LN8001254 Cooper
1270 2018 LNS139533 Jasper
1271 2018 LN8001883 Zoey Fisher
1272 2017 LN360022 Nacho
1273 2017 LNS136388 Lucy
1274 2018 LNS145444 Maui
1275 2017 LN137922 Tucker
1276 2018 LN8003472 Truffle
1277 2018 LN8001288 Sadie
1278 2018 LNS115428 Thatcher Norman Shoval
1279 2018 LNS118377 Blue
1280 2018 LNS140061 Panda
1281 2018 LNS143055 Rudy Norris
1282 2018 LN8000758 Chester
1283 2018 LN8001805 Lili
1284 2017 LNS120831 Toby
1285 2017 LNS138637 Harley
1286 2018 LNS137954 Benny
1287 2018 LNS109450 Mikey
1288 2018 LNS112412 Nieko
1289 2018 LN8003264 Payton
1290 2018 LN359252 Carter
1291 2018 LN8000608 Mori
1292 2018 LN357684 Cromwell
1293 2018 LN902931 Daisy
1294 2018 LNS145594 Murgatrod
1295 2018 LNS143083 Oreo
1296 2017 LN964031 Rin
1297 2018 LNS134400 Natalie
1298 2017 LN202706 Honee
1299 2017 LNS128386 Clive
1300 2018 LN8000346 Talia
1301 2017 LN282633 Mimi
1302 2018 LNS134362 Peanut Butter
1303 2018 LN282870 Olive
1304 2018 LNS142510 Spice
1305 2018 LNS115315 Bearegard
1306 2018 LNS147444 Ellie
1307 2018 LNS106580 Buttercup
1308 2017 LNS136700 Sukee
1309 2017 LNS137720 Belle
1310 2018 LN80017 Rowdy
1311 2017 LN283046 Henry
1312 2017 LNS133325 Zoe
1313 2018 LN8002624 Moose
1314 2017 LNS138327 Sonic
1315 2017 LNS132992 Chewie
1316 2018 LN26319 River
1317 2018 LNS114338 Shadow
1318 2018 LN904239 Hobbes
1319 2017 LNS145733 Nala
1320 2017 LN834358 Penny
1321 2018 LN135176 Nani
1322 2018 LNS143813 Ralph
1323 2018 LN211704 Ally
1324 2018 LNS126041 Molly
1325 2018 LNS101170 Otis
1326 2017 LNS127534 Medea
1327 2018 LNS141353 Winnie
1328 2017 LN141855 Penny
1329 2016 LNS125839 Mika
1330 2017 LNS105174 Patch
1331 2018 LNS145526 Twix
1332 2018 LN217839 Prince
1333 2016 LNS125038 Worm
1334 2018 LNS125629 Milo
1335 2018 LNS142274 Hastings
1336 2017 LNS137857 Theo
1337 2017 LNS106650 Floyd
1338 2018 LNS112264 McGrupp
1339 2018 LN83847 Willow
1340 2018 LNS145269 Bella
1341 2017 LN581112 Loki
1342 2017 LN282271 Monty
1343 2017 LNS134980 Loki
1344 2018 LNS122695 Flaco
1345 2018 LNS141820 Honey
1346 2018 LN8003008 Molly
1347 2017 LNS137997 Iris
1348 2017 LNS130441 Koko
1349 2018 LNS140949 Lola
1350 2018 LNS138955 Sati
1351 2017 LNS137224 Nikko
1352 2018 LN8002980 Helainora Sophia
1353 2017 LN215087 Roxy
1354 2018 LN216933 Talya
1355 2017 LNS134707 Xena
1356 2018 LNS132233 Franklin
1357 2018 LNS138434 Brewster
1358 2017 LNS139114 DeeDee
1359 2018 LNS145574 Carl
1360 2017 LN905131 Cooper
1361 2018 LN8003058 Layla
1362 2018 LN8001933 Quincy
1363 2018 LNS114138 Shorty
1364 2018 LNS128867 Sierra
1365 2018 LN216225 Kayla
1366 2017 LN29804 Pharoah
1367 2017 LNS102302 June
1368 2017 LN79509 Cora
1369 2017 LNS105523 Kona
1370 2018 LN8000810 Guinness
1371 2017 LNS131101 Gremlin
1372 2017 LN130842 Cleo
1373 2018 LNS112735 Garfield
1374 2017 LN208195 Nell
1375 2017 LN897989 Sissy
1376 2017 LNS128317 Etienne
1377 2017 LNS130861 Kenji
1378 2018 LNS140483 Goose
1379 2017 LN952488 Chloe
1380 2018 LN77348 Mia
1381 2018 LNS110134 Masha
1382 2017 LNS125327 Kavu
1383 2018 LN586336 Chewbacca
1384 2017 LNS105317 Nikki
1385 2018 LN8000826 Stella
1386 2018 LN83293 Kelly
1387 2018 LN353268 Mitzy
1388 2018 LNS118397 Sumo
1389 2018 LN273836 Harry
1390 2017 LN952487 Nena
1391 2018 LNS121362 Charlie
1392 2018 LNS147456 Luna Elizabeth
1393 2017 LN22423 Pepper
1394 2018 LNS147186 Croissant
1395 2017 LN282723 Nikki
1396 2017 LN72811 Suika
1397 2015 LNS106585 Daisey
1398 2018 LN199048 Salvadore
1399 2018 LNS147314 Gandalf
1400 2018 LNS145026 Cat 2
1401 2017 LNS138527 Sofie
1402 2017 LNS136243 Williwaw
1403 2017 LN901162 Cody
1404 2018 LNS147011 Charlie
1405 2017 LN357570 Winston
1406 2018 LNS138932 Bonnie
1407 2018 LNS142016 Wolfgang (Wolfy)
1408 2018 LN140360 Laszlo
1409 2018 LN731410 Henry
1410 2018 LNS109645 Luca
1411 2017 LNS129220 Freedom
1412 2018 LN444510 Sparky
1413 2017 LNS130524 Harley
1414 2018 LNS119702 Domino
1415 2018 LNS140210 Oreo
1416 2018 LNS126704 Archer
1417 2017 LN139260 Hugo
1418 2018 LN352641 Jody
1419 2017 LNS127920 Liby
1420 2018 LNS127605 Sophie
1421 2018 LN280359 Rainey
1422 2017 LN27612 Duska
1423 2018 LNS111734 Oscar
1424 2018 LN281765 Rocky
1425 2018 LNS111710 Honey
1426 2018 LNS120067 Gunner
1427 2017 LNS124568 Auggie
1428 2018 LNS144441 Skip
1429 2018 LN835060 Stellaluna
1430 2018 LN721943 Edie
1431 2018 LNS130216 Snowflake
1432 2018 LN575785 Wiley
1433 2018 LN139324 Cassie
1434 2018 LN441845 Perkins
1435 2018 LN8002461 Finn
1436 2017 LNS127002 Brandy
1437 2017 LN280570 Toby
1438 2018 LNS122110 Mia
1439 2017 LNS130870 Hagrid
1440 2018 LN357556 Cody
1441 2017 LN141622 Kuper
1442 2018 LN729077 Edgar
1443 2018 LNS144213 Jack
1444 2017 LNS138619 Rita
1445 2017 LN212808 Lola
1446 2018 LN24824 Jackson
1447 2018 LNS143511 Rufio
1448 2017 LNS108175 Deanie
1449 2018 LNS147000 Snooks
1450 2018 LN8002586 Raven
1451 2018 LN728639 Rover
1452 2017 LNS102845 Zoe
1453 2017 LNS126260 Daisy
1454 2018 LN903484 Jameson
1455 2018 LN584932 Lily
1456 2018 LNS139771 Sasha
1457 2017 LN831077 Sophie
1458 2018 LN8002787 Arthur
1459 2018 LNS102642 Lola
1460 2018 LN357199 Shadow
1461 2018 LN140835 Zage
1462 2017 LN441175 Precious
1463 2018 LNS140635 Sunny
1464 2017 LNS138913 Theo
1465 2018 LN951784 Chico
1466 2018 LN8001787 Puppy Brother
1467 2017 LN211172 Maggie Rose
1468 2017 LN957017 Banjo
1469 2018 LNS109709 Genji Umali
1470 2018 LN8002246 Gryffindor
1471 2016 LNS110272 Onyx
1472 2017 LNS128158 Cindy
1473 2017 LNS130019 Gemma
1474 2017 LN137898 Sanders
1475 2018 LN8000567 Squid
1476 2017 LNS133114 Edom
1477 2017 LN73128 Muffin
1478 2018 LN8001800 Sally
1479 2017 LNS101291 Poo Ying
1480 2018 LNS152300 Mango
1481 2018 LN730557 Binks
1482 2018 LN8003899 Jake
1483 2018 LN8003147 Reggie
1484 2017 LNS134309 Dolly
1485 2018 LNS145719 Madison
1486 2018 LN568884 Jackie
1487 2018 LNS143701 Jasmine
1488 2018 LNS119067 Elphie
1489 2017 LN833015 Avery
1490 2017 LN277234 Tigger
1491 2018 LN142129 Mocha
1492 2017 LNS131114 Maxwell Silver Hammerstrom-Guel
1493 2018 LN730558 Smudge
1494 2018 LN8003902 Jasper
1495 2018 LNS112737 Meena
1496 2018 LNS144202 Ray
1497 2017 LN731383 Bemo
1498 2018 LN962598 Thatcher
1499 2017 LN577911 Atari
1500 2017 LN896211 Hannah
1501 2017 LN949254 Stitch
1502 2018 LN8000445 Luigi
1503 2017 LNS105685 Mocha
1504 2017 LNS133345 Ally
1506 2018 LN727923 Tasha
1507 2018 LNS145837 Monster
1508 2018 LN944960 Rocky IV
1509 2017 LN584070 Maggie
1510 2018 LNS143264 Lulabelle
1511 2017 LN576860 Skipper
1512 2018 LN86261 Kuma
1513 2017 LNS132770 Bird
1514 2018 LNS140235 Kona
1515 2018 LN8003134 Arya
1516 2018 LNS113102 Kirk
1517 2018 LNS140550 Farmer
1518 2018 LNS142134 Oxford
1519 2018 LNS145181 Izzie
1520 2018 LNS128797 Bella
1521 2018 LN960337 Luna
1522 2018 LNS117162 Penny
1523 2018 LNS144685 Zooey
1524 2018 LNS129868 Buster
1525 2018 LNS138449 Maxx
1526 2018 LNS147792 Blackberry
1527 2018 LN134273 Spencer
1528 2018 LNS147123 Sonny Lee
1529 2017 LNS104231 Steve
1530 2018 LNS142348 Bob
1531 2018 LN29933 Charlie
1532 2018 LN725389 Ellie
1533 2018 LN904884 Penny
1534 2018 LN441875 Edgar
1535 2017 LN444830 Hanna
1536 2018 LN137333 Finn
1537 2018 LNS109832 Lucy
1538 2017 LN24007 Rocco
1539 2017 LN25600 Lobo
1540 2017 LNS126781 Grommet
1541 2018 LNS144834 Iggy Pup
1542 2018 LNS138044 Bentley
1543 2018 LNS113809 Abby
1544 2018 LNS132307 Rocket
1545 2018 LN27142 Ketchup
1546 2018 LNS119581 Scotty Smalls Sweeny
1547 2018 LN283897 Apollo
1548 2017 LN215802 Mina
1549 2016 LNS124550 Puggles
1550 2017 LNS132664 Reyka
1551 2018 LN8003607 Tallulah
1552 2018 LNS141258 Cohen
1553 2018 LN731194 Gigi
1554 2018 LN137103 Punkin
1555 2018 LN726628 Abbie
1556 2017 LNS130272 Pip
1557 2018 LNS146382 Sadie
1558 2018 LN8000807 Charlie
1559 2018 LNS144835 Isabelle
1560 2018 LN274480 Betsy
1561 2018 LNS120164 Lucy
1562 2018 LN8003880 Loka
1563 2017 LN28606 Elsie
1564 2018 LNS150141 Louie
1565 2018 LN715043 Cooper
1566 2018 LN956951 Witten
1567 2017 LN569968 Rocky
1568 2017 LN22589 Penny
1569 2018 LNS112919 Ashia
1570 2018 LN896716 Ruby
1571 2018 LN129101 Lady Chat
1572 2018 LNS145957 Reginald
1573 2017 LN898454 Stinker
1574 2016 LN22082 Mattie (formerly Sergeant)
1575 2017 LN133474 Lemieux
1576 2018 LNS136776 Bee
1577 2018 LNS138026 Blue
1578 2017 LNS104761 Allie Cat
1579 2018 LNS146992 Hunter
1580 2018 LNS140540 Nomar Garciaparra
1581 2017 LNS106646 Max Cat Eyler
1582 2018 LNS104048 Kirito
1583 2017 LNS127776 Eli
1584 2018 LN823790 Uncle Gus
1585 2015 LN892856 Lexy
1586 2018 LN8003503 Schumer
1587 2018 LNS139393 Zander
1588 2018 LN730467 Moxee
1589 2018 LNS134657 Laurel
1590 2018 LNS139603 T.K.
1591 2016 LN957804 Trilby
1592 2018 LNS129715 Susie
1593 2018 LN722752 Freckles
1594 2017 LNS127805 Hudson
1595 2018 LN728511 Maddie
1596 2018 LNS115225 Kuja
1597 2018 LN217890 Joy
1598 2017 LNS129210 Mico
1599 2018 LN358763 Chicken
1600 2018 LN733258 Charlie
1601 2018 LNS143706 Guinness
1602 2018 LN8001598 Bijou
1603 2018 LN209705 Sonny
1604 2017 LN30023 Savvy
1605 2018 LN441437 Potato
1606 2017 LN132789 Baxter
1607 2018 LNS139201 Toby
1608 2017 LNS117108 Honey-Bea
1609 2018 LNS138081 Chiquita
1610 2018 LNS143881 Bella
1611 2018 LNS105304 Bandi
1612 2018 LNS139777 Bubba
1613 2018 LN961373 Midna
1614 2018 LNS147239 Adam Hooch
1615 2018 LN954872 Riley
1616 2017 LNS130405 Sukoshi
1617 2018 LN441002 Blue
1618 2018 LNS138162 Sophie
1619 2018 LNS128012 Luka
1620 2018 LNS109219 Nala
1621 2017 LN359993 Cy Murray
1622 2018 LNS120095 Tad
1623 2018 LN8000022 Xander
1624 2018 LNS126021 Jack
1625 2018 LNS119537 Lucy
1626 2018 LN8001459 Martini
1627 2018 LNS125714 Quark
1628 2017 LN137770 Abbie
1629 2018 LNS106359 Maggie Mae
1630 2018 LNS135822 O*Zone
1631 2018 LN715708 Mango
1632 2017 LN897332 Muffin
1633 2018 LNS144722 Sami
1634 2017 LN353589 Frodo
1635 2018 LNS145412 Fred
1636 2018 LN896974 Squirt
1637 2017 LN817929 Salsa
1638 2018 LN444880 Knuckles
1639 2018 LNS109218 Tinkerbell
1640 2018 LNS141191 Max
1641 2017 LN361150 Charlie
1642 2018 LN897456 Sufjan
1643 2018 LNS129759 June Bug
1644 2018 LN127256 Sushi
1645 2018 LNS146798 Delta
1646 2018 LN349052 Enzo
1647 2018 LN833417 Sylvester
1648 2018 LNS147712 Anthony
1649 2018 LNS121162 Oreo
1650 2017 LN832743 Diamond
1651 2018 LNS120107 Posh
1652 2018 LNS126338 Merseyside
1653 2018 LNS128711 Raina
1654 2018 LN571386 Socks
1656 2018 LNS119803 Dewey
1657 2018 LN359159 Kira
1658 2018 LN8003017 Chewy
1659 2017 LNS104072 Eleanor
1660 2018 LN137052 Aamira
1661 2017 LN584763 Sooie
1662 2017 LNS133160 Penny
1663 2018 LNS143661 Tucker
1664 2017 LNS126160 Pepper
1665 2018 LN195716 Stormy
1666 2018 LNS110486 Eva Godzilla
1667 2017 LN81432 Perry
1668 2018 LNS143390 Rosie
1669 2018 LNS116898 Jeffrey
1670 2018 LNS111284 Jack
1671 2018 LNS114705 Tater
1672 2017 LNS101091 Winnie
1673 2017 LNS107848 Angus
1674 2017 LN139540 Coco
1675 2018 LN282025 Socks
1676 2018 LNS125353 Bones
1677 2018 LNS139148 Gryffin
1678 2018 LN8003610 Bandit
1679 2017 LN834408 Jacques2
1680 2017 LN444854 Chip
1681 2016 LNS125111 Saki
1682 2018 LNS116942 Lakota
1683 2018 LNS101064 Bailey
1684 2018 LN8000424 Ezra
1685 2018 LNS131011 Frasier
1686 2017 LN79188 Aldwyn
1687 2017 LN355844 Ruby
1688 2018 LN438361 Ginger
1689 2018 LN8000454 Rena Nofsinger
1690 2018 LNS105179 Kylie
1691 2017 LNS130196 Megatron
1692 2016 LNS141745 Jack
1693 2017 LN274562 Bucky
1694 2017 LN137703 Jay
1695 2017 LN834616 Boomer
1696 2018 LN8002649 Gabbana
1697 2017 LN436215 Rollie
1698 2018 LN8002131 Lexi
1699 2018 LNS130433 Riley
1700 2017 LNS105932 Jackie
1701 2018 LNS145364 Frodo
1702 2017 LN897212 Pi
1703 2017 LN949532 Dexter
1704 2018 LN8004242 Honu
1705 2017 LNS105352 Abby
1706 2018 LN22176 Pandora
1707 2017 LN74004 Tiny
1708 2016 LN948401 Lizzy
1709 2018 LN954242 Cassie
1710 2018 LN127565 Lola
1711 2017 LNS100309 Mab
1712 2018 LNS120286 Siamese
1713 2018 LNS139623 Rin
1714 2018 LN578076 Tucker
1715 2018 LN8003257 Walter
1716 2017 LNS137809 Fawkes
1717 2018 LN208581 Bailey
1718 2018 LNS148156 Lily
1719 2017 LN215241 Lady Snoops
1720 2018 LN204053 Nick
1721 2017 LNS105267 Boris
1722 2017 LN27145 Angelina
1723 2018 LNS139697 Simon
1724 2017 LN86396 Nettles
1725 2017 LN826914 Stella
1726 2018 LN585422 Izzy
1727 2018 LNS123939 Ivy
1728 2018 LN138311 Kaycee
1729 2017 LNS103533 Princess
1730 2018 LN958481 Zephyr B
1731 2018 LNS101183 Babee
1732 2017 LNS121826 George
1733 2018 LN439938 Josie
1734 2017 LN435652 Olivia
1735 2017 LN898784 Finnegan
1736 2017 LNS133527 Daisy
1737 2017 LNS138605 Livia
1738 2018 LN834742 Beatrice
1739 2017 LN438714 Moe
1740 2017 LNS101802 Roman
1741 2018 LNS144493 Lucy
1742 2018 LN81603 Yoshi
1743 2017 LNS106601 Ellie
1744 2018 LNS143406 Jacques
1745 2017 LN279328 Ninja
1746 2018 LNS127110 Beebo
1747 2018 LN8004150 Mac
1748 2017 LNS135737 Rio
1749 2018 LNS144139 Ivy
1750 2018 LN8003398 Nixon
1751 2017 LN82764 Nix
1752 2018 LNS145800 Luca
1753 2018 LNS146317 Daisy
1754 2018 LN213996 Muji Hopalong Pancake
1755 2017 LN139386 Baxter
1756 2018 LN30025 Friday
1757 2018 LNS129934 Luke
1758 2018 LNS140232 Nellie
1759 2017 LN83950 June
1760 2018 LNS143341 Auntie
1761 2018 LNS143466 Addie
1762 2016 LN133111 Dog Horse El.
1763 2018 LNS125230 Hamilton
1764 2018 LNS146853 Pablo
1765 2016 LNS119164 Snowflake
1766 2018 LN8000802 Biggie
1767 2017 LNS136955 Merle
1768 2018 LNS109257 Minnie
1769 2018 LNS138598 George
1770 2018 LNS104449 Leonidas
1771 2018 LNS111200 Winston
1772 2017 LN272430 Samantha
1773 2018 LN128543 Chibi
1774 2017 LN952033 Princess Anne
1775 2018 LNS141730 Lowell Katz
1776 2018 LNS121761 Jr
1777 2018 LNS112922 Chile
1778 2018 LN954627 Bella
1779 2018 LN281239 Ponyo
1780 2017 LN834364 Chacha
1781 2018 LNS111231 Gaia
1782 2017 LNS103006 Maggie
1783 2018 LN81944 Annie
1784 2018 LNS117873 Moti Harvey
1785 2017 LNS138901 Jax
1786 2017 LNS129402 Dexter
1787 2017 LN731505 Hudson
1788 2017 LNS132359 Rooney
1789 2018 LN904502 Gabby
1790 2018 LN825996 Teddy Bear
1791 2018 LN8000008 Cthulhu
1792 2017 LN142546 Freda
1793 2018 LNS138579 Tansy
1794 2018 LN276929 Aaliyah
1795 2017 LN824180 Zorro
1796 2017 LN28811 Dory
1797 2017 LN134163 Lbj
1798 2018 LN138818 Zelda
1799 2018 LN8000231 Levi
1800 2017 LNS111454 Lana
1801 2017 LNS133860 Max
1802 2017 LN79580 Luci
1803 2017 LN359686 Sally Mae
1804 2017 LNS106366 Diego
1805 2018 LN26994 Nanook
1806 2018 LN731263 Empress
1807 2018 LN443513 Nikita
1808 2017 LN904899 Henry
1809 2017 LNS131312 Kubo
1810 2018 LNS140406 Sounder
1811 2018 LNS146230 Ruby
1812 2017 LN79430 Friend
1813 2018 LNS142836 Harper
1814 2018 LN358038 Oliver Max
1815 2018 LNS140211 Luna
1816 2018 LN137890 Athena
1817 2017 LNS127904 Keira
1818 2017 LNS127192 Riley Rose
1819 2018 LNS136966 Gremlie
1820 2018 LNS142432 Trixie
1821 2018 LN583550 Henry
1822 2017 LN361023 Tillie
1823 2017 LN360510 Happy
1824 2018 LN216410 Remy
1825 2017 LN84038 Annabelle
1826 2018 LN584962 Mae
1827 2018 LNS115857 Coal
1828 2018 LN347482 Ned
1829 2018 LN134082 Houdini
1830 2018 LN8001168 Moonstone Whistler
1831 2016 LN73451 Frank Sinatra
1832 2018 LN19183 Spike
1833 2017 LN133006 Melon
1834 2018 LN897925 Dory
1835 2017 LN347240 Mia
1836 2018 LN73589 Snoopy
1837 2017 LNS134716 Sophie
1838 2018 LNS108287 Kiria
1839 2017 LN361201 Dickens
1840 2018 LNS128022 Artemis
1841 2018 LN8000908 Remy
1842 2017 LNS130508 Tina
1843 2018 LNS143357 Apollo
1844 2017 LNS133425 Kain
1845 2018 LNS123714 Remi
1846 2018 LNS109223 Annabelle
1847 2018 LNS115509 Rawlie
1848 2018 LNS144716 Leo
1849 2018 LN8002215 Key
1850 2018 LNS140667 Soappy
1851 2017 LNS125005 Deaf Jeff
1852 2018 LN217558 Damien
1853 2017 LN732743 Bruce Campbell
1854 2018 LNS145105 Cupcake
1855 2018 LN715343 Boo
1856 2018 LNS144336 Sonnet
1857 2017 LN26763 Nalu
1858 2015 LN964536 Rudy
1859 2018 LN8002102 Dexter
1860 2017 LNS106813 Mika
1861 2017 LNS135395 Lexi
1862 2018 LN8001550 Pepper
1863 2017 LNS132000 Aspen
1864 2018 LN136914 Luna
1865 2018 LNS109690 Dorothy
1866 2018 LN905497 Libby
1867 2018 LNS113796 Zuul
1868 2018 LNS142064 Remi
1869 2018 LNS101926 Penelope
1870 2017 LNS127723 Stewie
1871 2018 LN8000950 Kenzee
1872 2018 LNS139561 Macie
1873 2018 LN8002370 Bentley
1874 2018 LNS146573 Georgia
1875 2017 LNS136376 Maple
1876 2018 LN24441 Mocha
1877 2018 LN359541 Aldo
1878 2017 LN138064 Annie
1879 2018 LNS143111 Pippin
1880 2018 LNS102698 Kuma
1881 2018 LN213964 Max
1882 2018 LNS144234 Hailey
1883 2017 LN141418 Linus
1884 2018 LNS143863 Sophie
1885 2018 LNS113064 Muffin
1886 2017 LNS129787 Fritz
1887 2018 LNS140845 Rosie
1888 2018 LN443297 Zennor
1889 2018 LNS104075 Bonnie
1890 2018 LN960177 Jelli
1891 2018 LNS113276 Rosie
1892 2016 LN22873 Molly
1893 2018 LN216244 Jasmine
1894 2018 LNS139939 Ludo
1895 2017 LNS108592 Colt
1896 2018 LN211677 Mango
1897 2016 LN132101 Jordon
1898 2016 LN24880 Charlie
1899 2018 LNS110653 Buster
1900 2017 LN834695 Neville
1901 2017 LNS126073 Bingley
1902 2018 LNS118615 Cooper
1903 2017 LNS130587 Stewie
1904 2018 LN80564 Belle
1905 2017 LNS132475 Cookie
1906 2018 LN30036 Fritz
1907 2018 LN8000964 Iris
1908 2018 LNS145458 Emmylou
1909 2018 LNS151144 Stella
1910 2017 LN140256 Finnegan
1911 2017 LN582368 Charlie
1912 2017 LN580434 Wolfen
1913 2018 LN905902 Lucia
1914 2017 LNS120344 Cheerio
1915 2018 LN8000295 Porter
1916 2016 LNS101770 Tartufalo
1917 2018 LN23815 Pippin
1918 2018 LN20141 Penny
1919 2018 LNS142990 Shadow
1920 2018 LNS120444 Martha
1921 2017 LNS126458 Michelle
1922 2018 LN896435 Middy
1923 2018 LN824777 Huck
1924 2018 LN8002143 Bernice
1925 2017 LNS134970 Luna
1926 2018 LN204831 Macy
1927 2018 LN350730 Beatrix
1928 2017 LN142046 Maizey
1929 2017 LN198426 Zomkio
1930 2018 LN346553 Jessie
1931 2017 LNS133445 Audrey
1932 2018 LNS100824 Pumpkin
1933 2016 LNS123828 Scrappy
1934 2017 LNS105939 Dakota
1935 2017 LN142282 Phoebe
1936 2018 LNS136786 Duffle
1937 2018 LNS146312 Stuart
1938 2016 LN948984 Simba
1939 2018 LNS110094 Suki
1940 2018 LNS139753 Freddie
1941 2017 LNS104916 Sage
1942 2018 LNS127544 Thunder
1943 2018 LN822802 Debbie Hairy
1944 2017 LN18581 Allie
1945 2017 LN949953 Jackson
1946 2018 LNS145479 Nutmeg
1947 2018 LNS139776 Pepper
1948 2018 LNS147256 Jo Montana
1949 2018 LNS147257 Django
1950 2018 LN586530 Starbuck
1951 2017 LN203680 Lena
1952 2018 LN720485 Mish Mish
1953 2018 LN8000356 Cinnamon
1954 2017 LNS105554 Winston
1955 2018 LNS114676 Chedi Club Tanah Gajah
1956 2017 LNS101611 Emi-chan
species primary_breed
1 Dog Boxer
2 Dog Bichon Frise
3 Dog Mix
4 Dog Australian Shepherd
5 Dog Chihuahua, Short Coat
6 Dog Retriever, Labrador
7 Dog Lhasa Apso
8 Dog Basenji
9 Dog Pug
10 Dog Schnauzer, Miniature
11 Dog Chihuahua, Short Coat
12 Dog Havanese
13 Dog Retriever, Labrador
14 Dog Chow Chow
15 Dog Shiba Inu
16 Dog Chinese Shar-Pei
17 Dog Coton de Tulear
18 Dog Retriever, Golden
19 Dog Terrier, Yorkshire
20 Dog Chihuahua, Short Coat
21 Dog Border Collie
22 Cat Siberian
23 Cat Russian Blue
24 Cat Himalayan
25 Cat Maine Coon
26 Cat Domestic Longhair
27 Cat Domestic Shorthair
28 Cat Domestic Longhair
29 Cat Domestic Shorthair
30 Cat Domestic Shorthair
31 Cat Domestic Longhair
32 Cat Maine Coon
33 Dog Terrier, American Pit Bull
34 Dog Poodle, Standard
35 Dog Australian Cattle Dog
36 Dog Poodle, Miniature
37 Dog Bulldog
38 Dog Terrier, Jack Russell
39 Dog Shiba Inu
40 Dog Retriever, Labrador
41 Dog Terrier, American Pit Bull
42 Dog Poodle, Standard
43 Dog Mixed Breed, Large (over 44 lbs fully grown)
44 Dog Pomeranian
45 Dog Dachshund, Miniature Smooth Haired
46 Dog Terrier
47 Dog Retriever, Labrador
48 Dog Retriever, Labrador
49 Dog Affenpinscher
50 Dog Shih Tzu
51 Dog Border Collie
52 Dog Havanese
53 Dog Terrier, Rat
54 Dog Australian Shepherd
55 Dog Shetland Sheepdog
56 Dog Bichon Frise
57 Dog Norwegian Elkhound
58 Dog Bernese Mountain Dog
59 Dog Keeshond
60 Dog Retriever, Golden
61 Dog Retriever, Labrador
62 Dog Australian Cattle Dog
63 Dog Chow Chow
64 Dog Chihuahua, Short Coat
65 Dog Xoloitzcuintli
66 Dog Australian Shepherd, Miniature
67 Dog Retriever, Golden
68 Dog Mix
69 Dog Poodle, Standard
70 Dog Terrier, Silky
71 Cat Domestic Medium Hair
72 Cat Domestic Shorthair
73 Cat LaPerm
74 Cat Domestic Shorthair
75 Cat Domestic Shorthair
76 Cat Mix
77 Cat Domestic Medium Hair
78 Cat Domestic Shorthair
79 Cat Domestic Shorthair
80 Cat Ragdoll
81 Cat American Shorthair
82 Cat Mix
83 Cat Domestic Medium Hair
84 Cat Domestic Shorthair
85 Cat Domestic Shorthair
86 Cat Domestic Shorthair
87 Cat Domestic Shorthair
88 Cat Domestic Shorthair
89 Cat Domestic Medium Hair
90 Cat Domestic Medium Hair
91 Cat Egyptian Mau
92 Cat Mix
93 Cat Domestic Shorthair
94 Dog Shepherd
95 Dog Hound
96 Dog Poodle, Miniature
97 Dog Beagle
98 Dog Beagle
99 Dog Bulldog, French
100 Dog Spaniel, Cavalier King Charles
101 Dog Poodle, Miniature
102 Dog Chihuahua, Short Coat
103 Dog Spaniel, Tibetan
104 Dog Retriever, Labrador
105 Dog Australian Cattle Dog
106 Dog Retriever, Labrador
107 Dog Dachshund, Standard Wire Haired
108 Dog German Shepherd
109 Dog Spaniel, English Springer
110 Dog Border Collie
111 Dog Chow Chow
112 Dog Beagle
113 Dog Retriever, Labrador
114 Dog Terrier
115 Dog Siberian Husky
116 Dog German Shepherd
117 Dog Briard
118 Dog Miniature Pinscher
119 Dog Retriever, Labrador
120 Dog Retriever, Nova Scotia Duck Tolling
121 Dog Chihuahua, Short Coat
122 Dog Dachshund, Standard Long Haired
123 Dog Beauceron
124 Dog Border Collie
125 Dog Terrier, Pit Bull
126 Dog Border Collie
127 Dog Bichon Frise
128 Dog Pomeranian
129 Dog Retriever, Labrador
130 Dog Pekingese
131 Dog Spaniel, Cavalier King Charles
132 Dog Australian Shepherd
133 Dog Retriever, Labrador
134 Dog Retriever, Labrador
135 Dog Pomeranian
136 Dog Rhodesian Ridgeback
137 Dog Siberian Husky
138 Dog Greyhound
139 Dog Greater Swiss Mountain Dog
140 Dog Mixed Breed, Large (over 44 lbs fully grown)
141 Dog Mixed Breed, Large (over 44 lbs fully grown)
142 Dog Retriever, Labrador
143 Dog Shih Tzu
144 Dog Boxer
145 Dog Spaniel, American Cocker
146 Dog Australian Shepherd, Miniature
147 Dog Border Collie
148 Dog Terrier
149 Dog Pomeranian
150 Dog Chihuahua, Short Coat
151 Dog Hound
152 Dog Basset Hound
153 Dog Retriever, Labrador
154 Dog Dachshund, Miniature Smooth Haired
155 Dog Cur, Mountain
156 Dog Papillon
157 Dog Maltese
158 Dog Terrier, American Staffordshire
159 Dog Retriever, Labrador
160 Dog Retriever
161 Dog Vizsla, Smooth Haired
162 Dog Australian Cattle Dog
163 Dog Terrier, Cairn
164 Dog Bichon Frise
165 Dog Pug
166 Dog Dachshund, Standard Smooth Haired
167 Dog Terrier, American Pit Bull
168 Dog Terrier, Boston
169 Dog Retriever, Labrador
170 Dog Australian Shepherd
171 Dog German Shepherd
172 Dog Retriever
173 Dog Papillon
174 Dog Australian Shepherd, Miniature
175 Dog Beagle
176 Dog Retriever, Labrador
177 Dog Retriever, Golden
178 Dog Retriever, Labrador
179 Dog Schnauzer, Giant
180 Dog American Eskimo
181 Dog Australian Shepherd
182 Dog Miniature Pinscher
183 Dog Retriever, Golden
184 Dog Terrier, American Pit Bull
185 Dog Retriever, Labrador
186 Dog Bichon Frise
187 Dog Australian Cattle Dog
188 Dog Australian Shepherd
189 Dog Newfoundland
190 Dog Retriever, Labrador
191 Dog Pug
192 Dog Chihuahua, Short Coat
193 Cat Domestic Shorthair
194 Cat Domestic Shorthair
195 Cat Domestic Shorthair
196 Cat Domestic Shorthair
197 Cat Domestic Shorthair
198 Cat Domestic Shorthair
199 Cat Domestic Longhair
200 Cat Domestic Shorthair
201 Cat Domestic Shorthair
202 Cat American Shorthair
203 Cat Domestic Shorthair
204 Cat Maine Coon
205 Cat Domestic Longhair
206 Cat Domestic Shorthair
207 Cat Domestic Shorthair
208 Cat Domestic Shorthair
209 Cat Domestic Shorthair
210 Cat Domestic Shorthair
211 Cat Domestic Shorthair
212 Cat Domestic Shorthair
213 Cat Domestic Shorthair
214 Cat Domestic Shorthair
215 Cat Maine Coon
216 Cat Domestic Medium Hair
217 Cat Domestic Shorthair
218 Cat Domestic Shorthair
219 Cat Domestic Shorthair
220 Cat Domestic Shorthair
221 Cat Domestic Medium Hair
222 Cat Ragdoll
223 Cat Mix
224 Cat Domestic Shorthair
225 Cat Domestic Longhair
226 Cat Domestic Longhair
227 Cat Domestic Shorthair
228 Cat Siamese
229 Cat Domestic Shorthair
230 Cat Domestic Shorthair
231 Cat Domestic Shorthair
232 Cat Domestic Shorthair
233 Cat Domestic Longhair
234 Cat Domestic Shorthair
235 Cat Domestic Shorthair
236 Cat Domestic Medium Hair
237 Cat Domestic Shorthair
238 Cat American Shorthair
239 Cat Domestic Shorthair
240 Dog Retriever, Golden
241 Dog Retriever, Labrador
242 Dog Terrier, Cairn
243 Dog Terrier
244 Dog Shiba Inu
245 Dog Siberian Husky
246 Dog Terrier, Rat
247 Dog Chihuahua, Short Coat
248 Dog Terrier
249 Dog Lhasa Apso
250 Dog Terrier, Boston
251 Dog Terrier, Jack Russell
252 Dog Shih Tzu
253 Dog Newfoundland
254 Dog Keeshond
255 Cat Abyssinian
256 Cat Domestic Medium Hair
257 Cat American Shorthair
258 Cat Balinese
259 Cat Domestic Shorthair
260 Cat Domestic Medium Hair
261 Cat Domestic Shorthair
262 Cat Domestic Longhair
263 Cat Domestic Shorthair
264 Cat Domestic Shorthair
265 Dog Dachshund, Standard Long Haired
266 Dog Rottweiler
267 Dog Retriever, Golden
268 Dog Poodle, Toy
269 Dog German Shepherd
270 Dog Retriever, Golden
271 Dog Retriever, Labrador
272 Dog Spaniel, American Cocker
273 Dog Shih Tzu
274 Dog Retriever, Labrador
275 Dog German Shepherd
276 Dog Retriever, Labrador
277 Dog Australian Shepherd
278 Dog Retriever, Labrador
279 Dog Border Collie
280 Dog Lhasa Apso
281 Dog Terrier, Tibetan
282 Dog Terrier, Silky
283 Dog Spaniel, Tibetan
284 Dog Chihuahua, Long Coat
285 Dog Terrier, American Pit Bull
286 Dog Poodle, Toy
287 Dog Havanese
288 Dog Australian Shepherd
289 Dog Retriever, Labrador
290 Dog Retriever, Labrador
291 Dog German Shepherd
292 Dog Poodle, Miniature
293 Dog Retriever, Labrador
294 Dog Chihuahua, Short Coat
295 Dog German Shepherd
296 Dog Portuguese Water Dog
297 Dog Spaniel, Cavalier King Charles
298 Dog Poodle, Standard
299 Dog Retriever, Golden
300 Dog Lhasa Apso
301 Dog Terrier, West Highland White
302 Dog German Pinscher
303 Dog Old English Sheepdog
304 Dog Terrier, Jack Russell
305 Dog Chihuahua, Short Coat
306 Dog Shepherd
307 Dog Lhasa Apso
308 Dog Portuguese Water Dog
309 Dog Coonhound
310 Dog Terrier, Irish
311 Dog Maltese
312 Dog Coonhound
313 Dog Cur, Black-Mouth
314 Dog Spinone Italiano
315 Dog Schnauzer, Miniature
316 Dog Alaskan Husky
317 Dog Australian Cattle Dog
318 Dog Beagle
319 Dog Portuguese Water Dog
320 Dog German Shepherd
321 Cat Domestic Longhair
322 Cat Domestic Longhair
323 Cat Domestic Shorthair
324 Cat Domestic Shorthair
325 Cat Domestic Medium Hair
326 Cat Domestic Shorthair
327 Cat Siamese
328 Cat Domestic Shorthair
329 Cat Domestic Shorthair
330 Cat Domestic Shorthair
331 Cat Domestic Shorthair
332 Cat Domestic Shorthair
333 Cat Domestic Shorthair
334 Cat American Shorthair
335 Cat Siamese
336 Cat Domestic Shorthair
337 Cat Domestic Shorthair
338 Cat Domestic Medium Hair
339 Cat Domestic Shorthair
340 Cat Domestic Shorthair
341 Cat Domestic Shorthair
342 Cat American Shorthair
343 Cat Domestic Medium Hair
344 Cat LaPerm
345 Cat Domestic Shorthair
346 Cat Domestic Shorthair
347 Cat Russian Blue
348 Cat Domestic Shorthair
349 Cat Domestic Shorthair
350 Cat Domestic Shorthair
351 Cat Domestic Shorthair
352 Cat Domestic Shorthair
353 Cat Domestic Shorthair
354 Dog Australian Shepherd
355 Dog Terrier, American Pit Bull
356 Dog Pug
357 Dog Retriever, Labrador
358 Dog Terrier, Pit Bull
359 Dog Australian Shepherd
360 Dog Retriever, Golden
361 Dog Beagle
362 Dog Poodle, Miniature
363 Dog Terrier
364 Dog Terrier, American Pit Bull
365 Dog Terrier, Pit Bull
366 Dog Chihuahua, Short Coat
367 Dog German Shepherd
368 Dog Terrier, Yorkshire
369 Dog Xoloitzcuintli
370 Dog Terrier
371 Dog Rottweiler
372 Dog Australian Kelpie
373 Dog Maltese
374 Dog Retriever, Labrador
375 Dog Pointer, German Shorthaired
376 Dog Boxer
377 Dog Chihuahua, Short Coat
378 Dog Terrier, American Staffordshire
379 Dog Hound
380 Dog Poodle, Miniature
381 Dog Spaniel, English Springer
382 Dog Schnauzer, Miniature
383 Dog Dachshund, Standard Smooth Haired
384 Dog Dachshund, Standard Smooth Haired
385 Dog Chihuahua, Short Coat
386 Dog Dachshund, Standard Smooth Haired
387 Dog Pomeranian
388 Dog Chihuahua, Short Coat
389 Dog Terrier, Staffordshire Bull
390 Dog Terrier, Fox, Smooth
391 Dog Retriever, Labrador
392 Dog Retriever, Labrador
393 Dog Boxer
394 Dog Retriever, Golden
395 Dog Schnauzer, Standard
396 Dog Lhasa Apso
397 Dog Shih Tzu
398 Dog Australian Cattle Dog
399 Dog Welsh Corgi, Pembroke
400 Dog Border Collie
401 Dog Australian Cattle Dog
402 Dog Pug
403 Dog Border Collie
404 Dog Whippet
405 Dog Australian Shepherd
406 Dog Schnauzer, Miniature
407 Cat Domestic Shorthair
408 Cat Domestic Shorthair
409 Cat LaPerm
410 Cat Domestic Medium Hair
411 Cat Domestic Shorthair
412 Cat Domestic Shorthair
413 Cat Domestic Longhair
414 Cat Domestic Shorthair
415 Cat Domestic Shorthair
416 Cat Domestic Medium Hair
417 Cat Domestic Shorthair
418 Cat Domestic Shorthair
419 Cat Domestic Shorthair
420 Cat Domestic Shorthair
421 Cat Domestic Shorthair
422 Cat Domestic Medium Hair
423 Cat Domestic Shorthair
424 Cat Domestic Shorthair
425 Dog Retriever, Golden
426 Dog German Shepherd
427 Dog Retriever, Golden
428 Dog Siberian Husky
429 Dog Dachshund, Standard Smooth Haired
430 Dog Australian Shepherd
431 Dog Australian Cattle Dog
432 Dog Australian Cattle Dog
433 Dog Terrier, Boston
434 Dog Great Pyrenees
435 Dog Shetland Sheepdog
436 Dog Mix
437 Dog Bichon Frise
438 Dog Bulldog, American
439 Dog Poodle, Standard
440 Dog Terrier, Airedale
441 Dog Miniature Pinscher
442 Dog Mastiff
443 Dog Terrier
444 Dog Spaniel, American Water
445 Dog Bulldog, French
446 Dog Retriever, Labrador
447 Dog Retriever
448 Dog Greyhound
449 Dog German Shepherd
450 Dog German Shepherd
451 Dog Brittany
452 Dog Mix
453 Dog Terrier, Jack Russell
454 Dog Poodle, Miniature
455 Dog Chihuahua, Short Coat
456 Dog Terrier
457 Dog Australian Shepherd, Miniature
458 Dog Retriever, Labrador
459 Dog Australian Shepherd
460 Dog Schnauzer, Standard
461 Dog Retriever, Labrador
462 Dog Beagle
463 Dog Bulldog, English
464 Dog Havanese
465 Dog Spaniel, English Springer
466 Dog Spaniel, Cavalier King Charles
467 Dog Poodle, Standard
468 Dog Poodle, Standard
469 Dog Retriever, Labrador
470 Dog Whippet
471 Dog Retriever
472 Dog Retriever
473 Dog Border Collie
474 Dog Retriever, Labrador
475 Dog Retriever, Labrador
476 Dog Hound
477 Dog Carolina Dog
478 Dog Retriever, Labrador
479 Dog Retriever, Labrador
480 Dog Hound
481 Dog Spaniel, Cavalier King Charles
482 Dog Shiba Inu
483 Dog Chihuahua, Short Coat
484 Dog Terrier, Yorkshire
485 Dog Coonhound
486 Dog Retriever, Labrador
487 Dog Spaniel, English Springer
488 Cat Domestic Medium Hair
489 Cat Domestic Shorthair
490 Cat Domestic Longhair
491 Cat Domestic Shorthair
492 Cat Domestic Longhair
493 Cat Domestic Medium Hair
494 Cat Domestic Shorthair
495 Cat Domestic Shorthair
496 Cat Domestic Shorthair
497 Cat Domestic Shorthair
498 Cat Siamese
499 Cat Domestic Shorthair
500 Cat Maine Coon
501 Cat Domestic Shorthair
502 Cat Domestic Shorthair
503 Cat Domestic Shorthair
504 Cat Domestic Medium Hair
505 Cat Domestic Shorthair
506 Cat Maine Coon
507 Cat Domestic Shorthair
508 Cat Domestic Shorthair
509 Dog Miniature Pinscher
510 Dog Boxer
511 Dog Mixed Breed, Medium (up to 44 lbs fully grown)
512 Dog Australian Cattle Dog
513 Dog Shih Tzu
514 Dog Terrier, American Pit Bull
515 Dog Xoloitzcuintli
516 Dog Retriever, Labrador
517 Dog Terrier, American Staffordshire
518 Dog Retriever, Labrador
519 Dog Retriever, Labrador
520 Dog Bulldog
521 Dog Poodle, Miniature
522 Dog Rottweiler
523 Dog Terrier, Pit Bull
524 Dog Retriever, Labrador
525 Dog Australian Shepherd
526 Dog Retriever, Golden
527 Dog Rottweiler
528 Dog Maltese
529 Dog Boxer
530 Dog German Shepherd
531 Dog Chihuahua, Short Coat
532 Dog Terrier, Yorkshire
533 Dog Chihuahua, Short Coat
534 Dog Retriever, Labrador
535 Dog Terrier, Silky
536 Dog Terrier, American Pit Bull
537 Cat Domestic Shorthair
538 Cat Siamese
539 Cat Domestic Shorthair
540 Cat Domestic Longhair
541 Cat Siberian
542 Cat Domestic Shorthair
543 Cat Domestic Shorthair
544 Cat Domestic Longhair
545 Dog Poodle, Standard
546 Dog Retriever, Labrador
547 Dog Chihuahua, Short Coat
548 Dog Dutch Shepherd
549 Dog Retriever, Labrador
550 Dog Bulldog, English
551 Dog Terrier, Border
552 Dog Dachshund, Standard Long Haired
553 Dog American Eskimo
554 Dog Portuguese Water Dog
555 Dog Schnauzer, Miniature
556 Dog Retriever, Golden
557 Dog Vizsla, Smooth Haired
558 Dog American Eskimo
559 Dog Retriever, Labrador
560 Dog Australian Cattle Dog
561 Dog Retriever, Golden
562 Dog Australian Shepherd
563 Dog Terrier, American Staffordshire
564 Dog Chihuahua, Short Coat
565 Dog Bulldog, French
566 Dog Retriever, Labrador
567 Dog Weimaraner
568 Dog Retriever, Labrador
569 Dog Retriever, Golden
570 Dog Boxer
571 Dog Retriever, Golden
572 Dog Retriever, Golden
573 Dog Poodle, Standard
574 Dog Terrier, Airedale
575 Dog Retriever, Golden
576 Dog Terrier, Cairn
577 Dog American Eskimo
578 Dog Spaniel, English Springer
579 Dog Australian Shepherd
580 Dog Poodle, Miniature
581 Dog Shih Tzu
582 Dog Shih Tzu
583 Dog Spaniel
584 Cat Sphynx
585 Cat Domestic Medium Hair
586 Cat Domestic Shorthair
587 Cat Domestic Longhair
588 Cat Domestic Shorthair
589 Cat Domestic Shorthair
590 Cat Domestic Medium Hair
591 Cat Domestic Medium Hair
592 Cat Domestic Shorthair
593 Cat Domestic Shorthair
594 Cat Domestic Shorthair
595 Cat Domestic Shorthair
596 Cat Domestic Shorthair
597 Cat Siamese
598 Cat Russian Blue
599 Cat Domestic Medium Hair
600 Cat Domestic Longhair
601 Cat Ragdoll
602 Cat Domestic Shorthair
603 Cat Domestic Shorthair
604 Cat Domestic Medium Hair
605 Cat Domestic Shorthair
606 Dog Beagle
607 Dog Retriever, Labrador
608 Dog Terrier, Rat
609 Dog Retriever, Labrador
610 Dog Havanese
611 Dog Australian Shepherd
612 Dog Retriever, Labrador
613 Dog Retriever, Labrador
614 Dog Retriever, Labrador
615 Dog Terrier, Pit Bull
616 Dog Retriever, Labrador
617 Dog Retriever, Labrador
618 Dog Retriever, Golden
619 Dog Retriever, Labrador
620 Dog Retriever, Labrador
621 Dog Australian Shepherd
622 Dog Siberian Husky
623 Dog Xoloitzcuintli
624 Dog Poodle, Miniature
625 Dog Kooikerhondje
626 Dog Terrier, Welsh
627 Dog Terrier
628 Dog Terrier, Airedale
629 Dog Retriever, Labrador
630 Dog Terrier, American Pit Bull
631 Dog Mixed Breed, Large (over 44 lbs fully grown)
632 Dog Retriever, Labrador
633 Dog Retriever, Labrador
634 Dog Retriever, Labrador
635 Dog Pointer
636 Dog Retriever, Labrador
637 Dog Mix
638 Dog Siberian Husky
639 Dog Retriever, Labrador
640 Dog Siberian Husky
641 Dog Terrier
642 Dog Retriever, Golden
643 Dog Poodle, Standard
644 Dog Terrier, Yorkshire
645 Dog Retriever, Golden
646 Cat Domestic Shorthair
647 Cat Domestic Shorthair
648 Cat Domestic Shorthair
649 Cat Domestic Medium Hair
650 Cat Domestic Shorthair
651 Cat Domestic Medium Hair
652 Cat Domestic Longhair
653 Cat Domestic Shorthair
654 Cat Domestic Shorthair
655 Cat Domestic Shorthair
656 Cat Pixie-Bob
657 Cat Domestic Shorthair
658 Cat Domestic Shorthair
659 Cat Domestic Shorthair
660 Cat Domestic Shorthair
661 Cat Domestic Longhair
662 Cat Domestic Medium Hair
663 Cat Russian Blue
664 Cat Domestic Shorthair
665 Cat Domestic Shorthair
666 Cat Domestic Shorthair
667 Cat Domestic Shorthair
668 Cat Domestic Shorthair
669 Cat Domestic Shorthair
670 Cat Domestic Shorthair
671 Cat Tonkinese
672 Cat Domestic Shorthair
673 Cat Domestic Shorthair
674 Cat Domestic Medium Hair
675 Cat Russian Blue
676 Cat Domestic Shorthair
677 Dog Terrier, American Pit Bull
678 Dog Boxer
679 Dog Chihuahua, Short Coat
680 Dog Australian Shepherd
681 Dog Vizsla, Smooth Haired
682 Dog Belgian Malinois
683 Dog American Blue Heeler
684 Dog Australian Shepherd
685 Dog Bichon Frise
686 Dog Terrier, Yorkshire
687 Dog Dalmatian
688 Dog Chow Chow
689 Dog Retriever, Labrador
690 Dog Poodle, Standard
691 Dog Retriever, Labrador
692 Dog Retriever, Labrador
693 Dog Terrier, Jack Russell
694 Dog Retriever, Labrador
695 Dog Terrier, Yorkshire
696 Dog Chihuahua, Short Coat
697 Dog Retriever, Labrador
698 Dog Retriever, Golden
699 Dog Terrier
700 Dog Spaniel, English Springer
701 Dog Retriever, Golden
702 Dog Retriever, Golden
703 Dog Poodle, Miniature
704 Dog German Shepherd
705 Dog Terrier, American Pit Bull
706 Dog Boxer
707 Dog German Shepherd
708 Dog German Shepherd
709 Dog Retriever
710 Dog Greyhound
711 Dog Pomeranian
712 Dog Schnauzer, Miniature
713 Dog Schnauzer, Standard
714 Dog Terrier, Manchester
715 Dog Chihuahua, Short Coat
716 Dog Retriever, Labrador
717 Dog Spaniel, English Springer
718 Dog Welsh Corgi, Cardigan
719 Dog Chihuahua, Short Coat
720 Dog Xoloitzcuintli
721 Dog Havanese
722 Dog Retriever, Labrador
723 Dog German Shepherd
724 Dog Retriever, Labrador
725 Dog Retriever, Labrador
726 Dog Retriever, Labrador
727 Dog Shepherd
728 Dog Poodle, Miniature
729 Dog Retriever, Chesapeake Bay
730 Dog Portuguese Water Dog
731 Dog Shih Tzu
732 Dog Miniature Pinscher
733 Dog Spaniel, American Cocker
734 Dog Retriever, Labrador
735 Dog Chihuahua, Short Coat
736 Dog Retriever, Labrador
737 Dog Australian Cattle Dog
738 Dog Retriever
739 Dog Terrier, Jack Russell
740 Dog Bearded Collie
741 Dog Mixed Breed, Small (under 24 lbs fully grown)
742 Dog Spaniel, Cavalier King Charles
743 Dog Retriever, Labrador
744 Dog Retriever, Labrador
745 Dog Rottweiler
746 Dog Terrier, Yorkshire
747 Dog Terrier
748 Dog Great Pyrenees
749 Dog Chow Chow
750 Dog Newfoundland
751 Dog Retriever, Labrador
752 Dog Greyhound
753 Dog Shepherd
754 Dog Retriever, Labrador
755 Dog Mix
756 Dog Spaniel, English Toy
757 Dog German Shepherd
758 Dog Retriever, Labrador
759 Dog Australian Shepherd
760 Dog Shepherd
761 Dog Retriever, Labrador
762 Dog Japanese Chin
763 Dog Dachshund, Miniature Smooth Haired
764 Dog Griffon, Wirehaired Pointing
765 Dog Spaniel, Cavalier King Charles
766 Dog Retriever, Golden
767 Dog Chihuahua, Short Coat
768 Dog Welsh Corgi, Pembroke
769 Dog Spaniel, American Cocker
770 Dog Australian Shepherd
771 Cat Domestic Shorthair
772 Cat Domestic Shorthair
773 Cat Domestic Shorthair
774 Cat Domestic Medium Hair
775 Cat Domestic Shorthair
776 Cat Domestic Shorthair
777 Cat Domestic Shorthair
778 Cat Domestic Shorthair
779 Cat Domestic Shorthair
780 Cat Domestic Longhair
781 Cat Domestic Longhair
782 Cat Domestic Shorthair
783 Cat Domestic Shorthair
784 Cat Abyssinian
785 Cat Domestic Shorthair
786 Cat Domestic Shorthair
787 Cat Mix
788 Cat Domestic Shorthair
789 Cat Domestic Medium Hair
790 Cat Domestic Medium Hair
791 Cat Ragdoll
792 Cat Domestic Shorthair
793 Cat Domestic Medium Hair
794 Cat Domestic Medium Hair
795 Cat Domestic Shorthair
796 Cat Domestic Medium Hair
797 Cat Domestic Medium Hair
798 Cat Domestic Medium Hair
799 Cat Domestic Shorthair
800 Cat Domestic Shorthair
801 Cat Domestic Shorthair
802 Cat Domestic Medium Hair
803 Cat Domestic Shorthair
804 Cat British Shorthair
805 Cat Siamese
806 Cat Domestic Shorthair
807 Cat Domestic Shorthair
808 Cat Siamese
809 Cat Domestic Shorthair
810 Cat Domestic Shorthair
811 Cat Maine Coon
812 Cat Maine Coon
813 Cat Russian Blue
814 Cat Manx
815 Cat Domestic Medium Hair
816 Cat Domestic Shorthair
817 Cat Domestic Shorthair
818 Cat Domestic Medium Hair
819 Dog Bulldog, English
820 Dog Schnauzer, Standard
821 Dog Mix
822 Dog Great Pyrenees
823 Dog Brittany
824 Dog Retriever, Golden
825 Dog Retriever, Labrador
826 Dog Retriever, Labrador
827 Dog Spaniel, English Cocker
828 Dog German Shepherd
829 Dog Chihuahua, Short Coat
830 Dog Retriever, Labrador
831 Dog Shih Tzu
832 Dog Terrier
833 Dog Poodle, Standard
834 Dog Chow Chow
835 Dog Terrier, Jack Russell
836 Dog Pointer, German Shorthaired
837 Dog Retriever, Labrador
838 Dog Basenji
839 Dog Retriever, Labrador
840 Dog Basset Hound
841 Dog Boxer
842 Dog Papillon
843 Dog Beagle
844 Dog Chihuahua, Short Coat
845 Dog Maltese
846 Dog Australian Cattle Dog
847 Dog Retriever, Labrador
848 Dog German Shepherd
849 Dog Lhasa Apso
850 Dog Chihuahua, Short Coat
851 Dog Welsh Corgi, Cardigan
852 Dog Retriever, Golden
853 Dog Retriever, Labrador
854 Dog Retriever, Labrador
855 Dog Siberian Husky
856 Dog Spaniel, Cavalier King Charles
857 Dog Australian Shepherd
858 Dog Retriever, Labrador
859 Dog Schnauzer, Miniature
860 Dog Retriever, Chesapeake Bay
861 Dog Chow Chow
862 Dog Alaskan Husky
863 Dog Doberman Pinscher
864 Dog Terrier
865 Dog Australian Shepherd
866 Dog Boxer
867 Dog Terrier, Soft Coated Wheaten
868 Dog Chihuahua, Short Coat
869 Dog Retriever, Labrador
870 Dog Pomeranian
871 Dog Welsh Corgi, Pembroke
872 Dog Setter, English
873 Dog Terrier, Cairn
874 Dog Chihuahua, Short Coat
875 Dog Border Collie
876 Dog Border Collie
877 Dog Basenji
878 Dog Chihuahua, Short Coat
879 Dog Schnauzer, Miniature
880 Dog Retriever, Labrador
881 Dog Coton de Tulear
882 Dog Italian Greyhound
883 Dog Retriever, Labrador
884 Dog Terrier
885 Cat Domestic Longhair
886 Cat Domestic Shorthair
887 Cat Domestic Medium Hair
888 Cat Domestic Medium Hair
889 Cat Domestic Longhair
890 Cat Domestic Longhair
891 Cat Domestic Shorthair
892 Cat Domestic Shorthair
893 Cat LaPerm
894 Cat Domestic Shorthair
895 Cat Domestic Shorthair
896 Cat Domestic Longhair
897 Cat Domestic Shorthair
898 Cat Domestic Shorthair
899 Cat Domestic Longhair
900 Cat Domestic Shorthair
901 Cat Himalayan
902 Cat Domestic Shorthair
903 Cat Domestic Longhair
904 Cat Manx
905 Cat Domestic Longhair
906 Cat Domestic Medium Hair
907 Cat Domestic Shorthair
908 Cat Domestic Shorthair
909 Cat Domestic Shorthair
910 Cat Maine Coon
911 Cat Siamese
912 Cat Domestic Medium Hair
913 Cat Domestic Medium Hair
914 Cat Domestic Medium Hair
915 Cat Ragdoll
916 Cat Domestic Shorthair
917 Cat Domestic Shorthair
918 Cat Domestic Shorthair
919 Cat Domestic Medium Hair
920 Cat LaPerm
921 Cat Domestic Shorthair
922 Cat Domestic Shorthair
923 Cat Domestic Shorthair
924 Dog Poodle, Toy
925 Dog Welsh Corgi, Pembroke
926 Dog Dachshund, Standard Smooth Haired
927 Dog Terrier, Yorkshire
928 Dog Retriever, Labrador
929 Dog Retriever, Golden
930 Dog Terrier, Border
931 Dog Retriever, Labrador
932 Dog Australian Cattle Dog
933 Dog Retriever, Golden
934 Dog Terrier, American Staffordshire
935 Dog Spaniel, English Springer
936 Dog Retriever, Labrador
937 Dog Siberian Husky
938 Dog Terrier
939 Dog German Shepherd
940 Dog Havanese
941 Dog Havanese
942 Dog Border Collie
943 Dog Dachshund, Standard Smooth Haired
944 Dog Poodle, Standard
945 Dog Maltese
946 Dog Terrier, Border
947 Dog Terrier, Boston
948 Dog Terrier, American Pit Bull
949 Dog English Shepherd
950 Dog Australian Cattle Dog
951 Dog Chihuahua, Short Coat
952 Dog Terrier, Australian
953 Dog Pug
954 Dog Spaniel, English Springer
955 Dog Poodle, Miniature
956 Dog Whippet
957 Dog Italian Greyhound
958 Dog Great Pyrenees
959 Dog Retriever, Labrador
960 Dog Newfoundland
961 Dog Retriever, Curly Coated
962 Dog Retriever, Labrador
963 Dog Retriever, Labrador
964 Dog Siberian Husky
965 Dog Border Collie
966 Dog Retriever, Labrador
967 Dog Retriever, Labrador
968 Dog Shih Tzu
969 Dog Retriever, Labrador
970 Dog Chihuahua, Short Coat
971 Dog Terrier, Rat
972 Dog Retriever, Golden
973 Dog Retriever, Labrador
974 Dog Maltese
975 Dog Rottweiler
976 Dog Retriever, Labrador
977 Dog Australian Cattle Dog
978 Dog Mix
979 Dog Retriever, Chesapeake Bay
980 Dog Retriever, Labrador
981 Dog Retriever, Golden
982 Dog Dachshund, Miniature Smooth Haired
983 Dog Bearded Collie
984 Dog Shih Tzu
985 Dog Havanese
986 Dog Poodle, Miniature
987 Dog Terrier
988 Dog Spaniel, American Cocker
989 Dog Chihuahua, Short Coat
990 Dog Basenji
991 Dog Spaniel, American Cocker
992 Dog Border Collie
993 Dog Retriever, Labrador
994 Dog Bichon Frise
995 Dog Mix
996 Dog Chihuahua, Short Coat
997 Dog Australian Cattle Dog
998 Dog Spaniel, American Cocker
999 Dog Keeshond
1000 Dog Schnauzer, Standard
1001 Dog Chihuahua, Short Coat
1002 Dog Spaniel, English Cocker
1003 Dog Border Collie
1004 Dog Shetland Sheepdog
1005 Dog Australian Shepherd
1006 Dog Retriever, Labrador
1007 Dog Welsh Corgi, Cardigan
1008 Dog Pug
1009 Dog Terrier, Boston
1010 Dog Doberman Pinscher
1011 Dog Terrier
1012 Dog Terrier, Yorkshire
1013 Dog Retriever, Labrador
1014 Dog Beagle
1015 Dog Greater Swiss Mountain Dog
1016 Dog Basenji
1017 Dog Terrier, West Highland White
1018 Dog Pointer, German Shorthaired
1019 Dog Shepherd
1020 Dog Terrier, West Highland White
1021 Dog Welsh Corgi, Pembroke
1022 Dog Retriever, Labrador
1023 Dog Retriever, Labrador
1024 Dog Retriever, Labrador
1025 Dog Poodle, Miniature
1026 Dog Australian Shepherd
1027 Dog Chinese Crested
1028 Dog Dalmatian
1029 Dog Pug
1030 Dog Border Collie
1031 Dog Poodle, Toy
1032 Dog Poodle, Miniature
1033 Dog Terrier, Boston
1034 Dog Shih Tzu
1035 Dog Australian Cattle Dog
1036 Dog Border Collie
1037 Dog Terrier
1038 Dog Retriever, Golden
1039 Dog Coonhound, Treeing Walker
1040 Cat Domestic Shorthair
1041 Cat Domestic Shorthair
1042 Cat Domestic Shorthair
1043 Cat Domestic Medium Hair
1044 Cat Domestic Shorthair
1045 Cat Domestic Shorthair
1046 Cat Domestic Longhair
1047 Cat Domestic Shorthair
1048 Cat Domestic Shorthair
1049 Cat Domestic Shorthair
1050 Cat Turkish Van
1051 Cat Domestic Shorthair
1052 Cat Domestic Shorthair
1053 Cat Domestic Shorthair
1054 Cat Domestic Shorthair
1055 Cat Siamese
1056 Cat Domestic Longhair
1057 Cat Domestic Shorthair
1058 Cat Snowshoe
1059 Cat Domestic Shorthair
1060 Cat Domestic Shorthair
1061 Cat Domestic Longhair
1062 Cat Domestic Medium Hair
1063 Cat Domestic Medium Hair
1064 Cat Domestic Medium Hair
1065 Cat Domestic Shorthair
1066 Cat Domestic Medium Hair
1067 Cat Domestic Shorthair
1068 Cat Russian Blue
1069 Cat Domestic Shorthair
1070 Cat Domestic Shorthair
1071 Cat Domestic Shorthair
1072 Cat American Shorthair
1073 Cat Pixie-Bob
1074 Cat Domestic Shorthair
1075 Cat Domestic Longhair
1076 Cat Domestic Shorthair
1077 Cat Domestic Shorthair
1078 Cat Domestic Shorthair
1079 Cat American Shorthair
1080 Cat Domestic Shorthair
1081 Cat Domestic Shorthair
1082 Cat Domestic Shorthair
1083 Cat Siamese
1084 Cat Domestic Longhair
1085 Cat Siamese
1086 Cat Domestic Medium Hair
1087 Cat Domestic Shorthair
1088 Dog Terrier, Russell
1089 Dog Chow Chow
1090 Dog Bernese Mountain Dog
1091 Dog Retriever, Labrador
1092 Dog German Shepherd
1093 Dog Poodle, Standard
1094 Dog Papillon
1095 Dog Shepherd
1096 Dog Chihuahua, Long Coat
1097 Dog Terrier
1098 Dog Retriever, Labrador
1099 Dog Chihuahua, Short Coat
1100 Dog German Shepherd
1101 Dog Terrier, American Pit Bull
1102 Dog Mixed Breed, Large (over 44 lbs fully grown)
1103 Dog Chihuahua, Short Coat
1104 Dog English Shepherd
1105 Dog Terrier
1106 Dog Chihuahua, Short Coat
1107 Dog Chihuahua, Short Coat
1108 Dog Old English Sheepdog
1109 Dog Vizsla, Smooth Haired
1110 Dog Terrier, American Pit Bull
1111 Dog Weimaraner
1112 Dog Dachshund, Standard Smooth Haired
1113 Dog Chihuahua, Short Coat
1114 Dog Spaniel, Welsh Springer
1115 Dog German Shepherd
1116 Dog Schnauzer, Miniature
1117 Dog Hound
1118 Dog Retriever, Labrador
1119 Dog Chihuahua, Short Coat
1120 Dog Retriever, Labrador
1121 Dog Retriever, Labrador
1122 Dog Australian Cattle Dog
1123 Dog Retriever, Labrador
1124 Dog Chihuahua, Short Coat
1125 Dog Collie, Smooth
1126 Dog Great Pyrenees
1127 Dog Terrier
1128 Dog Irish Wolfhound
1129 Dog Shepherd
1130 Dog Chow Chow
1131 Dog Retriever, Labrador
1132 Dog Retriever, Labrador
1133 Dog Coonhound
1134 Dog Mixed Breed, Medium (up to 44 lbs fully grown)
1135 Dog Terrier, Jack Russell
1136 Dog Setter, Irish
1137 Dog Terrier
1138 Dog Retriever, Labrador
1139 Dog Boxer
1140 Dog Terrier, American Pit Bull
1141 Dog Terrier, Airedale
1142 Dog Terrier, Jack Russell
1143 Dog Hound
1144 Dog Chihuahua, Long Coat
1145 Dog Dachshund, Miniature Smooth Haired
1146 Dog Shih Tzu
1147 Dog Terrier, Australian
1148 Dog Terrier, American Pit Bull
1149 Dog Mixed Breed, Medium (up to 44 lbs fully grown)
1150 Dog Border Collie
1151 Dog Retriever, Golden
1152 Dog Retriever, Golden
1153 Dog Pug
1154 Dog Portuguese Water Dog
1155 Dog Retriever, Labrador
1156 Dog Hound
1157 Dog Pointer, German Shorthaired
1158 Dog Retriever, Golden
1159 Dog Retriever, Labrador
1160 Dog Spaniel, Cavalier King Charles
1161 Dog Terrier
1162 Cat Domestic Longhair
1163 Cat Domestic Shorthair
1164 Cat Domestic Shorthair
1165 Cat Domestic Shorthair
1166 Cat Domestic Shorthair
1167 Cat Domestic Shorthair
1168 Cat Domestic Shorthair
1169 Cat Domestic Shorthair
1170 Cat Domestic Shorthair
1171 Cat Domestic Shorthair
1172 Cat Domestic Shorthair
1173 Cat Domestic Medium Hair
1174 Cat Maine Coon
1175 Cat Domestic Shorthair
1176 Cat Ragdoll
1177 Cat Domestic Shorthair
1178 Cat Bombay
1179 Cat Domestic Shorthair
1180 Cat Domestic Shorthair
1181 Cat Domestic Shorthair
1182 Cat Domestic Shorthair
1183 Cat Domestic Shorthair
1184 Cat Domestic Medium Hair
1185 Dog German Shepherd
1186 Dog Chihuahua, Short Coat
1187 Dog Ibizan Hound
1188 Dog Retriever
1189 Dog Shih Tzu
1190 Dog Border Collie
1191 Dog Boxer
1192 Dog Schnauzer, Miniature
1193 Dog Poodle, Toy
1194 Dog Spaniel, American Cocker
1195 Dog Greyhound
1196 Dog Terrier
1197 Dog Retriever, Golden
1198 Dog Hound
1199 Dog Terrier, American Pit Bull
1200 Dog Pomeranian
1201 Dog Retriever, Golden
1202 Dog Xoloitzcuintli
1203 Dog Terrier, Boston
1204 Dog Terrier, Staffordshire Bull
1205 Dog Terrier, American Pit Bull
1206 Dog Mix
1207 Dog Retriever, Golden
1208 Dog Retriever, Labrador
1209 Dog Chihuahua, Short Coat
1210 Dog Australian Shepherd
1211 Dog Beagle
1212 Dog Shepherd
1213 Dog Terrier, Welsh
1214 Dog Retriever, Labrador
1215 Dog Retriever, Labrador
1216 Dog Poodle, Miniature
1217 Dog Retriever, Labrador
1218 Dog Pomeranian
1219 Dog Chihuahua, Short Coat
1220 Dog German Shepherd
1221 Dog Vizsla, Smooth Haired
1222 Dog Chihuahua, Short Coat
1223 Dog Pug
1224 Dog Retriever, Labrador
1225 Dog Pointer
1226 Dog Maltese
1227 Dog Terrier, Jack Russell
1228 Dog Pug
1229 Dog Retriever, Labrador
1230 Dog Retriever, Labrador
1231 Dog Shepherd
1232 Dog Poodle, Toy
1233 Dog Terrier, Soft Coated Wheaten
1234 Dog Mix
1235 Dog Collie, Smooth
1236 Dog Australian Shepherd
1237 Dog Retriever, Golden
1238 Dog Retriever, Labrador
1239 Dog Australian Shepherd, Miniature
1240 Dog Retriever, Labrador
1241 Dog Retriever, Labrador
1242 Cat Domestic Medium Hair
1243 Cat Domestic Shorthair
1244 Cat Domestic Shorthair
1245 Cat Ragdoll
1246 Cat Domestic Shorthair
1247 Cat Domestic Shorthair
1248 Cat Domestic Shorthair
1249 Cat Siamese
1250 Cat Domestic Shorthair
1251 Cat Domestic Longhair
1252 Cat Siberian
1253 Cat Manx
1254 Cat Siamese
1255 Cat Domestic Shorthair
1256 Cat Domestic Shorthair
1257 Cat Domestic Shorthair
1258 Cat Domestic Longhair
1259 Cat Exotic Shorthair
1260 Cat Manx
1261 Cat Domestic Shorthair
1262 Cat Domestic Shorthair
1263 Cat Domestic Shorthair
1264 Cat Domestic Longhair
1265 Cat Domestic Shorthair
1266 Cat Domestic Medium Hair
1267 Cat Domestic Medium Hair
1268 Dog Retriever, Labrador
1269 Dog Spaniel
1270 Dog American Eskimo
1271 Dog Bulldog
1272 Dog Lhasa Apso
1273 Dog Chihuahua, Short Coat
1274 Dog Mix
1275 Dog Terrier, Rat
1276 Dog Poodle, Miniature
1277 Dog Terrier
1278 Dog Bulldog, English
1279 Dog Australian Shepherd
1280 Dog Terrier, Staffordshire Bull
1281 Dog Spaniel
1282 Dog Retriever, Labrador
1283 Dog Pointer, German Wirehaired
1284 Dog Pug
1285 Dog Shepherd
1286 Dog Poodle, Standard
1287 Dog Chihuahua, Short Coat
1288 Dog Pomeranian
1289 Dog Retriever, Labrador
1290 Dog Schnauzer, Miniature
1291 Dog Whippet
1292 Dog Spaniel, English Toy
1293 Dog Pug
1294 Cat Domestic Medium Hair
1295 Cat American Shorthair
1296 Cat Domestic Medium Hair
1297 Cat Domestic Shorthair
1298 Cat Domestic Medium Hair
1299 Cat Domestic Shorthair
1300 Cat Mix
1301 Cat Domestic Shorthair
1302 Cat Domestic Shorthair
1303 Cat Domestic Shorthair
1304 Cat Domestic Shorthair
1305 Cat Oriental Shorthair
1306 Dog Boxer
1307 Dog Retriever, Labrador
1308 Dog Chihuahua, Short Coat
1309 Dog Retriever, Flat-Coated
1310 Dog Poodle, Standard
1311 Dog Bulldog, English
1312 Dog Catahoula Leopard dog
1313 Dog Poodle, Standard
1314 Dog Mix
1315 Dog Chihuahua, Short Coat
1316 Dog Pointer, German Shorthaired
1317 Dog Boxer
1318 Dog Retriever, Golden
1319 Dog Australian Cattle Dog
1320 Dog Brittany
1321 Dog Shiba Inu
1322 Dog Shih Tzu
1323 Dog Retriever, Labrador
1324 Dog Bulldog, English
1325 Dog Spaniel, American Cocker
1326 Dog Retriever, Labrador
1327 Dog Retriever, Labrador
1328 Dog Dachshund, Standard Smooth Haired
1329 Dog Terrier, Yorkshire
1330 Dog Bulldog, French
1331 Dog Chihuahua, Short Coat
1332 Dog Pomeranian
1333 Dog Basset Hound
1334 Dog Retriever, Labrador
1335 Dog Retriever, Golden
1336 Dog Australian Shepherd
1337 Dog Bichon Frise
1338 Dog American Blue Heeler
1339 Dog Australian Shepherd
1340 Dog Bulldog, French
1341 Dog Poodle, Miniature
1342 Dog Welsh Corgi, Pembroke
1343 Dog Welsh Corgi, Pembroke
1344 Dog Chihuahua, Short Coat
1345 Dog Chihuahua, Short Coat
1346 Dog Retriever, Golden
1347 Dog German Shepherd
1348 Dog Papillon
1349 Dog Siberian Husky
1350 Dog Retriever, Flat-Coated
1351 Dog Shiba Inu
1352 Dog Papillon
1353 Dog Terrier, Jack Russell
1354 Dog Belgian Malinois
1355 Dog Alaskan Malamute
1356 Dog Retriever, Labrador
1357 Dog Beagle
1358 Dog Terrier, Bull
1359 Dog Retriever, Golden
1360 Dog Terrier
1361 Dog Rottweiler
1362 Dog Australian Shepherd
1363 Dog Chihuahua, Short Coat
1364 Dog German Shepherd
1365 Dog Retriever, Labrador
1366 Dog Pointer, German Shorthaired
1367 Dog Terrier, American Pit Bull
1368 Dog Chihuahua, Long Coat
1369 Dog Bulldog, French
1370 Dog Retriever, Labrador
1371 Cat Domestic Shorthair
1372 Cat Domestic Shorthair
1373 Cat Domestic Shorthair
1374 Cat American Shorthair
1375 Cat Domestic Shorthair
1376 Cat Siamese
1377 Cat Domestic Shorthair
1378 Cat Domestic Medium Hair
1379 Cat Domestic Shorthair
1380 Cat Domestic Shorthair
1381 Cat Domestic Medium Hair
1382 Cat Domestic Shorthair
1383 Cat Domestic Shorthair
1384 Cat Domestic Shorthair
1385 Cat Domestic Shorthair
1386 Cat Domestic Medium Hair
1387 Cat Domestic Shorthair
1388 Cat Domestic Shorthair
1389 Cat American Shorthair
1390 Cat Domestic Shorthair
1391 Cat Domestic Shorthair
1392 Cat Maine Coon
1393 Cat Domestic Shorthair
1394 Cat Domestic Shorthair
1395 Cat Domestic Shorthair
1396 Cat Domestic Shorthair
1397 Cat Domestic Shorthair
1398 Cat Domestic Shorthair
1399 Cat Domestic Medium Hair
1400 Cat Domestic Shorthair
1401 Dog Shetland Sheepdog
1402 Dog Australian Kelpie
1403 Dog Australian Shepherd
1404 Dog Retriever, Golden
1405 Dog Pug
1406 Dog Siberian Husky
1407 Dog Terrier, Yorkshire
1408 Dog German Shepherd
1409 Dog Feist
1410 Dog Dutch Shepherd
1411 Dog Australian Cattle Dog
1412 Dog Terrier, Rat
1413 Dog Retriever, Labrador
1414 Dog Terrier, American Staffordshire
1415 Dog Shih Tzu
1416 Dog German Shepherd
1417 Dog Retriever, Golden
1418 Dog Great Dane
1419 Dog Chihuahua, Short Coat
1420 Dog Welsh Corgi, Pembroke
1421 Dog Great Dane
1422 Dog Siberian Husky
1423 Dog Beagle
1424 Dog Norwegian Elkhound
1425 Dog Pomeranian
1426 Dog Retriever, Labrador
1427 Dog Terrier, American Pit Bull
1428 Dog Mix
1429 Dog Terrier
1430 Dog Maltese
1431 Dog Maltese
1432 Dog Retriever, Labrador
1433 Dog Australian Shepherd
1434 Dog Terrier
1435 Dog Retriever, Labrador
1436 Dog Plott Hound
1437 Dog Greyhound
1438 Dog Maltese
1439 Dog Pug
1440 Dog Shepherd
1441 Dog Retriever, Golden
1442 Dog Retriever, Golden
1443 Dog Retriever, Labrador
1444 Dog Greyhound
1445 Dog Terrier, American Pit Bull
1446 Dog Shepherd
1447 Dog Terrier
1448 Dog Terrier
1449 Dog Chihuahua, Short Coat
1450 Dog Mixed Breed, Large (over 44 lbs fully grown)
1451 Dog Australian Cattle Dog
1452 Dog Schnauzer, Miniature
1453 Dog Beagle
1454 Dog Brittany
1455 Dog Retriever, Labrador
1456 Dog Dutch Shepherd
1457 Dog Retriever, Labrador
1458 Dog Poodle, Miniature
1459 Dog Retriever, Labrador
1460 Dog Poodle, Miniature
1461 Dog Retriever, Golden
1462 Dog Chihuahua, Short Coat
1463 Dog Chihuahua, Short Coat
1464 Dog Retriever, Labrador
1465 Dog Bichon Frise
1466 Dog Basset Hound
1467 Dog Siberian Husky
1468 Dog Australian Cattle Dog
1469 Dog Retriever, Labrador
1470 Dog Retriever, Golden
1471 Dog Retriever
1472 Dog Dachshund, Standard Smooth Haired
1473 Dog Boxer
1474 Dog Retriever, Labrador
1475 Cat Domestic Shorthair
1476 Cat LaPerm
1477 Cat LaPerm
1478 Cat Domestic Shorthair
1479 Cat Siamese
1480 Cat Domestic Shorthair
1481 Cat Domestic Shorthair
1482 Cat Domestic Shorthair
1483 Cat Maine Coon
1484 Cat Domestic Shorthair
1485 Cat American Shorthair
1486 Cat Domestic Medium Hair
1487 Cat Domestic Shorthair
1488 Cat Domestic Shorthair
1489 Cat Domestic Shorthair
1490 Cat LaPerm
1491 Cat Ragdoll
1492 Cat Domestic Shorthair
1493 Cat Domestic Longhair
1494 Cat Domestic Medium Hair
1495 Cat Domestic Shorthair
1496 Cat Domestic Shorthair
1497 Cat Domestic Shorthair
1498 Cat Domestic Longhair
1499 Cat Domestic Medium Hair
1500 Cat Domestic Shorthair
1501 Cat Domestic Medium Hair
1502 Cat Pixie-Bob
1503 Cat Domestic Longhair
1504 Cat Domestic Shorthair
1506 Dog Shih Tzu
1507 Dog Chow Chow
1508 Dog Terrier
1509 Dog Terrier, Cairn
1510 Dog Poodle, Miniature
1511 Dog Border Collie
1512 Dog Retriever, Labrador
1513 Dog Pointer
1514 Dog Olde English Bulldogge
1515 Dog Shepherd
1516 Dog Australian Cattle Dog
1517 Dog Retriever, Labrador
1518 Dog Bulldog, French
1519 Dog Terrier
1520 Dog Retriever, Labrador
1521 Dog Poodle, Standard
1522 Dog Terrier, American Staffordshire
1523 Dog German Shepherd
1524 Dog Terrier, Yorkshire
1525 Dog Terrier, American Staffordshire
1526 Dog Spaniel, American Cocker
1527 Dog Pointer, German Wirehaired
1528 Dog Siberian Husky
1529 Dog Pointer, German Shorthaired
1530 Dog Spaniel, Cavalier King Charles
1531 Dog Chihuahua, Short Coat
1532 Dog Havanese
1533 Dog Brittany
1534 Dog Retriever, Golden
1535 Dog Chihuahua, Short Coat
1536 Dog Terrier, Jack Russell
1537 Dog Terrier, Boston
1538 Dog Terrier, American Pit Bull
1539 Dog Havanese
1540 Dog Bulldog, American
1541 Dog Border Collie
1542 Dog Poodle, Standard
1543 Dog Retriever
1544 Dog Border Collie
1545 Dog Beagle
1546 Dog Plott Hound
1547 Dog Xoloitzcuintli
1548 Dog Alaskan Malamute
1549 Dog Pug
1550 Dog Retriever, Labrador
1551 Dog Terrier
1552 Dog Terrier, American Staffordshire
1553 Dog Pointer, German Shorthaired
1554 Dog Retriever, Labrador
1555 Dog Pug
1556 Dog Border Collie
1557 Dog American Eskimo
1558 Dog Terrier, Jack Russell
1559 Dog Bulldog, American
1560 Dog Pug
1561 Cat Domestic Shorthair
1562 Cat Maine Coon
1563 Cat Domestic Shorthair
1564 Cat Domestic Shorthair
1565 Cat Domestic Longhair
1566 Cat Domestic Medium Hair
1567 Cat Domestic Shorthair
1568 Cat Domestic Shorthair
1569 Cat Domestic Shorthair
1570 Cat American Shorthair
1571 Cat Domestic Shorthair
1572 Cat Domestic Shorthair
1573 Cat Domestic Shorthair
1574 Cat Domestic Shorthair
1575 Cat Domestic Shorthair
1576 Cat Domestic Shorthair
1577 Cat Domestic Medium Hair
1578 Cat American Shorthair
1579 Cat Domestic Shorthair
1580 Cat Domestic Medium Hair
1581 Cat Domestic Shorthair
1582 Cat Domestic Shorthair
1583 Cat Domestic Shorthair
1584 Cat Domestic Medium Hair
1585 Cat Domestic Shorthair
1586 Cat Domestic Shorthair
1587 Cat Domestic Shorthair
1588 Cat Domestic Shorthair
1589 Cat Domestic Shorthair
1590 Cat Mix
1591 Dog Poodle, Standard
1592 Dog Chihuahua, Short Coat
1593 Dog Dachshund, Standard Smooth Haired
1594 Dog Retriever, Golden
1595 Dog Doberman Pinscher
1596 Dog Spaniel, Welsh Springer
1597 Dog Terrier
1598 Dog Papillon
1599 Dog Chihuahua, Short Coat
1600 Dog Australian Shepherd
1601 Dog Retriever, Labrador
1602 Dog Bichon Frise
1603 Dog Pomeranian
1604 Dog Siberian Husky
1605 Dog Greyhound
1606 Dog Rottweiler
1607 Dog McNab Herding Dog
1608 Dog Spaniel, Cavalier King Charles
1609 Dog Chihuahua, Short Coat
1610 Dog Chihuahua, Short Coat
1611 Dog Lhasa Apso
1612 Dog Terrier, Pit Bull
1613 Dog Australian Cattle Dog
1614 Dog Bulldog, English
1615 Dog Shih Tzu
1616 Dog Australian Shepherd, Miniature
1617 Dog Catahoula Leopard dog
1618 Dog Spaniel, Cavalier King Charles
1619 Dog Shih Tzu
1620 Dog Terrier, American Pit Bull
1621 Dog Boxer
1622 Dog Chihuahua, Short Coat
1623 Dog Bulldog, French
1624 Dog Newfoundland
1625 Dog Retriever, Golden
1626 Dog Whippet
1627 Dog Chihuahua, Short Coat
1628 Dog Border Collie
1629 Dog Australian Shepherd, Miniature
1630 Cat Domestic Shorthair
1631 Cat Domestic Longhair
1632 Cat Domestic Shorthair
1633 Cat American Shorthair
1634 Cat Domestic Shorthair
1635 Cat Domestic Longhair
1636 Cat Domestic Shorthair
1637 Cat Domestic Shorthair
1638 Cat Domestic Shorthair
1639 Cat Domestic Medium Hair
1640 Cat Domestic Shorthair
1641 Cat Domestic Shorthair
1642 Cat Domestic Longhair
1643 Cat Domestic Medium Hair
1644 Cat Siamese
1645 Cat American Shorthair
1646 Cat Domestic Shorthair
1647 Cat Domestic Longhair
1648 Cat Domestic Shorthair
1649 Cat Domestic Shorthair
1650 Cat Domestic Shorthair
1651 Cat Domestic Longhair
1652 Cat Domestic Shorthair
1653 Cat Maine Coon
1654 Cat Domestic Longhair
1656 Dog Miniature Pinscher
1657 Dog Retriever, Labrador
1658 Dog Setter, Gordon
1659 Dog Bulldog, English
1660 Dog Terrier, American Pit Bull
1661 Dog Terrier, Border
1662 Dog Welsh Corgi, Cardigan
1663 Dog Retriever, Golden
1664 Dog American Blue Heeler
1665 Dog Papillon
1666 Dog Border Collie
1667 Dog Griffon, Brussels
1668 Dog Retriever, Labrador
1669 Dog Pomeranian
1670 Dog Spaniel, American Cocker
1671 Dog Retriever, Golden
1672 Dog Plott Hound
1673 Dog Australian Shepherd
1674 Dog American Eskimo
1675 Dog Border Collie
1676 Dog Mixed Breed, Large (over 44 lbs fully grown)
1677 Dog Retriever
1678 Dog Foxhound, American
1679 Dog Poodle, Miniature
1680 Dog Chihuahua, Short Coat
1681 Dog Australian Cattle Dog
1682 Dog German Shepherd
1683 Dog Terrier, Fox, Wire
1684 Dog Retriever
1685 Dog Spaniel, Cavalier King Charles
1686 Dog Terrier, Boston
1687 Dog Retriever, Labrador
1688 Dog Retriever, Labrador
1689 Dog Australian Cattle Dog
1690 Dog Australian Cattle Dog
1691 Dog Retriever, Golden
1692 Dog Terrier, American Pit Bull
1693 Dog Spaniel, Cavalier King Charles
1694 Dog Greyhound
1695 Dog Retriever, Labrador
1696 Dog Terrier, Jack Russell
1697 Dog Rottweiler
1698 Dog Bulldog, American
1699 Dog Retriever, Golden
1700 Dog Terrier, Jack Russell
1701 Cat Domestic Shorthair
1702 Cat Domestic Longhair
1703 Cat Domestic Medium Hair
1704 Cat Domestic Shorthair
1705 Cat Domestic Shorthair
1706 Cat Domestic Longhair
1707 Cat Domestic Medium Hair
1708 Cat Domestic Shorthair
1709 Cat Domestic Shorthair
1710 Cat Domestic Shorthair
1711 Cat Domestic Medium Hair
1712 Cat Siamese
1713 Cat Mix
1714 Cat Domestic Shorthair
1715 Cat Domestic Shorthair
1716 Cat Domestic Shorthair
1717 Cat LaPerm
1718 Cat Domestic Medium Hair
1719 Cat Domestic Shorthair
1720 Cat Abyssinian
1721 Dog Schnauzer, Miniature
1722 Dog Terrier, Yorkshire
1723 Dog Retriever, Labrador
1724 Dog Australian Cattle Dog
1725 Dog Shepherd
1726 Dog Retriever, Golden
1727 Dog Border Collie
1728 Dog German Shepherd
1729 Dog Retriever, Labrador
1730 Dog Bernese Mountain Dog
1731 Dog Chihuahua, Short Coat
1732 Dog Shiba Inu
1733 Dog Italian Greyhound
1734 Dog Australian Shepherd
1735 Dog Terrier, Soft Coated Wheaten
1736 Dog Basset Hound
1737 Dog Welsh Corgi, Pembroke
1738 Dog Mexican Hairless
1739 Dog Terrier, Jack Russell
1740 Dog Australian Shepherd
1741 Dog Retriever, Golden
1742 Dog Shiba Inu
1743 Dog Chihuahua, Short Coat
1744 Dog Bulldog, French
1745 Dog Terrier, American Pit Bull
1746 Dog Boxer
1747 Dog Retriever, Labrador
1748 Dog Leonberger
1749 Dog Retriever, Labrador
1750 Dog Terrier, Border
1751 Dog Shiba Inu
1752 Dog Retriever, Golden
1753 Dog Hound
1754 Dog Boxer
1755 Dog Retriever, Labrador
1756 Dog Retriever, Golden
1757 Dog Retriever, Labrador
1758 Dog Catahoula Leopard dog
1759 Dog Retriever, Golden
1760 Dog Rottweiler
1761 Dog Terrier, Jack Russell
1762 Cat Domestic Shorthair
1763 Cat Maine Coon
1764 Cat Domestic Shorthair
1765 Cat Domestic Shorthair
1766 Cat Domestic Shorthair
1767 Cat Domestic Shorthair
1768 Cat Domestic Medium Hair
1769 Cat Domestic Longhair
1770 Cat Domestic Shorthair
1771 Cat Domestic Shorthair
1772 Cat Abyssinian
1773 Cat Domestic Shorthair
1774 Cat Manx
1775 Cat Domestic Shorthair
1776 Cat Domestic Shorthair
1777 Cat Domestic Shorthair
1778 Cat Domestic Medium Hair
1779 Dog German Shepherd
1780 Dog Terrier, American Staffordshire
1781 Dog Cane Corso
1782 Dog Terrier, Boston
1783 Dog Retriever, Labrador
1784 Dog Retriever, Labrador
1785 Dog Catahoula Leopard dog
1786 Dog Pomeranian
1787 Dog Retriever, Labrador
1788 Dog Alaskan Malamute
1789 Dog Boxer
1790 Dog Bernese Mountain Dog
1791 Cat Domestic Medium Hair
1792 Cat Domestic Medium Hair
1793 Cat Ragdoll
1794 Cat Domestic Medium Hair
1795 Cat Siamese
1796 Cat Domestic Shorthair
1797 Cat Siamese
1798 Dog Havanese
1799 Dog Retriever, Labrador
1800 Dog Collie, Smooth
1801 Dog Shetland Sheepdog
1802 Dog Retriever, Labrador
1803 Dog German Shepherd
1804 Dog English Shepherd
1805 Dog Retriever, Labrador
1806 Dog Retriever, Labrador
1807 Dog Shetland Sheepdog
1808 Dog Retriever, Labrador
1809 Dog Mix
1810 Dog Retriever, Labrador
1811 Dog Retriever, Labrador
1812 Dog Dachshund, Standard Smooth Haired
1813 Dog Australian Cattle Dog
1814 Dog Xoloitzcuintli
1815 Dog Pomeranian
1816 Dog Retriever, Labrador
1817 Dog Retriever, Labrador
1818 Dog Havanese
1819 Dog Pomeranian
1820 Dog Shetland Sheepdog
1821 Dog Retriever, Labrador
1822 Dog Border Collie
1823 Dog Maltese
1824 Dog Retriever, Labrador
1825 Dog Terrier, Airedale
1826 Dog Vizsla, Smooth Haired
1827 Cat Domestic Shorthair
1828 Cat Domestic Medium Hair
1829 Cat Domestic Shorthair
1830 Cat Domestic Shorthair
1831 Cat Siberian
1832 Cat LaPerm
1833 Cat Domestic Shorthair
1834 Cat British Shorthair
1835 Cat Domestic Shorthair
1836 Cat Siamese
1837 Cat Domestic Shorthair
1838 Cat Domestic Shorthair
1839 Cat Domestic Shorthair
1840 Cat Domestic Shorthair
1841 Dog Catahoula Leopard dog
1842 Dog Retriever, Golden
1843 Dog Welsh Corgi, Pembroke
1844 Dog Terrier, American Pit Bull
1845 Dog Terrier, Yorkshire
1846 Dog Spaniel, Cavalier King Charles
1847 Dog Retriever, Golden
1848 Dog Bulldog, French
1849 Dog Terrier, American Pit Bull
1850 Dog Akbash
1851 Dog Terrier, American Pit Bull
1852 Cat Maine Coon
1853 Cat Devon Rex
1854 Cat Domestic Shorthair
1855 Cat Domestic Shorthair
1856 Cat Domestic Shorthair
1857 Dog Retriever, Labrador
1858 Dog Chihuahua, Short Coat
1859 Dog Retriever, Labrador
1860 Dog Australian Shepherd
1861 Dog Terrier, Boston
1862 Dog Terrier, Cairn
1863 Dog Border Collie
1864 Dog Bulldog, French
1865 Dog Shih Tzu
1866 Dog Terrier
1867 Dog Pug
1868 Dog Terrier, Staffordshire Bull
1869 Dog Retriever, Labrador
1870 Dog Terrier, Staffordshire Bull
1871 Dog Retriever, Golden
1872 Dog Border Collie
1873 Dog Shih Tzu
1874 Dog Spaniel, English Springer
1875 Dog Poodle, Standard
1876 Dog Shih Tzu
1877 Dog Siberian Husky
1878 Dog Terrier, Fox, Smooth
1879 Dog Terrier, West Highland White
1880 Dog Shiba Inu
1881 Dog Terrier, American Pit Bull
1882 Dog Brittany
1883 Dog Bulldog, French
1884 Dog Terrier, Cairn
1885 Dog Havanese
1886 Dog Miniature Pinscher
1887 Dog Terrier, Boston
1888 Dog Pointer, German Wirehaired
1889 Dog Border Collie
1890 Dog Retriever, Golden
1891 Dog Retriever, Labrador
1892 Dog Terrier, Yorkshire
1893 Dog Boxer
1894 Dog Terrier, Pit Bull
1895 Dog Setter, English
1896 Dog Retriever, Golden
1897 Dog Retriever, Labrador
1898 Dog Rhodesian Ridgeback
1899 Dog Great Dane
1900 Dog Border Collie
1901 Dog Poodle, Standard
1902 Dog German Shepherd
1903 Dog Pomeranian
1904 Dog Retriever, Golden
1905 Dog Havanese
1906 Dog Schnauzer, Miniature
1907 Dog Dachshund, Miniature Long Haired
1908 Dog Terrier, American Pit Bull
1909 Dog Terrier
1910 Dog Terrier
1911 Dog Spaniel, American Cocker
1912 Dog Rottweiler
1913 Dog Retriever, Labrador
1914 Dog Griffon Vendeen, Petit Basset
1915 Dog Retriever, Golden
1916 Dog Lagotto Romagnolo
1917 Dog Shepherd
1918 Dog Schnauzer, Miniature
1919 Dog German Shepherd
1920 Dog Mix
1921 Cat Domestic Shorthair
1922 Cat Domestic Shorthair
1923 Cat Domestic Longhair
1924 Cat Domestic Shorthair
1925 Cat Domestic Shorthair
1926 Cat Siamese
1927 Cat Domestic Shorthair
1928 Cat Domestic Shorthair
1929 Cat Domestic Medium Hair
1930 Cat Domestic Medium Hair
1931 Cat Domestic Shorthair
1932 Cat Domestic Shorthair
1933 Cat Domestic Shorthair
1934 Cat Burmese
1935 Cat Domestic Shorthair
1936 Cat Domestic Shorthair
1937 Cat Domestic Shorthair
1938 Cat Siamese
1939 Cat Domestic Shorthair
1940 Cat Domestic Shorthair
1941 Cat Domestic Shorthair
1942 Cat Siamese
1943 Cat Domestic Shorthair
1944 Cat Domestic Shorthair
1945 Cat Domestic Medium Hair
1946 Cat Domestic Shorthair
1947 Cat Domestic Shorthair
1948 Cat Domestic Shorthair
1949 Cat Domestic Shorthair
1950 Cat American Shorthair
1951 Cat Domestic Shorthair
1952 Cat Domestic Shorthair
1953 Cat Domestic Medium Hair
1954 Cat Domestic Medium Hair
1955 Dog Havanese
1956 Dog Terrier, Lakeland
secondary_breed weight_kg
1 Mix 29.15
2 Havanese 23.70
3 Unknown 21.13
4 Mix 18.70
5 Terrier 20.36
6 Unknown 11.51
7 Unknown 23.30
8 Unknown 6.89
9 Beagle 16.78
10 Terrier, Silky 16.24
11 Unknown 29.91
12 Unknown 22.35
13 Poodle, Standard 23.06
14 Unknown 21.91
15 Unknown 21.46
16 Doberman Pinscher 30.14
17 Unknown 22.70
18 Poodle, Standard 18.20
19 Bulldog, American 14.75
20 Dachshund, Standard Smooth Haired 31.06
21 Australian Cattle Dog 21.40
22 Unknown 4.73
23 Unknown 4.46
24 Mix 4.66
25 Bengal 4.63
26 Unknown 4.49
27 Mix 4.51
28 Mix 4.24
29 Unknown 4.58
30 Mix 4.33
31 Mix 4.34
32 Mix 4.42
33 Mix 22.65
34 Retriever, Golden 21.13
35 Unknown 25.56
36 Maltese 20.38
37 Unknown 20.48
38 Unknown 29.35
39 Unknown 20.75
40 German Shepherd 17.61
41 Beagle 21.25
42 Retriever, Golden 30.52
43 Mix 20.76
44 Mix 23.87
45 Mix 22.52
46 Unknown 30.88
47 Unknown 12.27
48 Unknown 24.08
49 Unknown 20.93
50 Unknown 22.52
51 Mix 17.10
52 Unknown 21.74
53 Unknown 23.26
54 Unknown 28.12
55 Pomeranian 19.62
56 Unknown 21.64
57 Terrier 21.20
58 Unknown 24.93
59 Unknown 25.57
60 Unknown 11.61
61 Unknown 28.60
62 Unknown 22.93
63 German Shepherd 10.24
64 Unknown 15.48
65 Unknown 32.01
66 Mix 21.69
67 Unknown 25.00
68 American Blue Heeler 26.70
69 Unknown 18.25
70 Mix 24.71
71 Unknown 3.94
72 Unknown 3.89
73 Unknown 4.48
74 Unknown 4.05
75 Mix 4.31
76 Angora 4.10
77 Mix 4.50
78 Unknown 4.50
79 Unknown 4.53
80 Unknown 4.51
81 Unknown 4.67
82 Mix 4.38
83 Unknown 4.39
84 Unknown 4.69
85 Mix 4.60
86 Mix 5.11
87 Unknown 4.20
88 Unknown 3.67
89 Unknown 4.49
90 Unknown 4.74
91 Unknown 5.18
92 Unknown 4.82
93 Bengal 4.43
94 Unknown 13.81
95 Mix 26.10
96 Chihuahua, Short Coat 15.21
97 Unknown 24.45
98 Mix 20.50
99 Unknown 25.89
100 Poodle, Miniature 17.16
101 American Eskimo 28.16
102 Mix 28.72
103 Unknown 13.37
104 German Shepherd 25.85
105 Mix 26.55
106 Unknown 24.99
107 Unknown 25.54
108 Mix 16.74
109 Unknown 16.01
110 Unknown 28.09
111 Unknown 2.64
112 Unknown 26.34
113 Australian Cattle Dog 13.31
114 Miniature Pinscher 5.87
115 Unknown 17.35
116 Unknown 30.13
117 Unknown 11.40
118 Unknown 17.11
119 Unknown 19.95
120 Unknown 28.29
121 Terrier, Rat 25.95
122 Australian Shepherd 16.67
123 Mix 39.29
124 Australian Shepherd 21.67
125 Terrier, Pit Bull 32.86
126 Retriever, Flat-Coated 7.85
127 Unknown 20.65
128 American Eskimo 17.47
129 Poodle, Standard 23.80
130 Pomeranian 22.02
131 Mix 22.15
132 Unknown 18.62
133 Mix 13.72
134 Poodle, Standard 13.11
135 Poodle, Miniature 21.77
136 Unknown 30.18
137 Unknown 23.86
138 Unknown 23.52
139 Unknown 27.54
140 Mix 24.22
141 Retriever, Labrador 32.46
142 Unknown 14.34
143 Unknown 14.17
144 Retriever, Labrador 9.93
145 Unknown 18.30
146 Unknown 21.24
147 Rottweiler 25.33
148 Unknown 15.34
149 Unknown 18.00
150 Mix 11.19
151 Basenji 16.84
152 Unknown 18.04
153 Unknown 16.93
154 Unknown 18.68
155 Unknown 27.28
156 Mix 26.16
157 Poodle, Miniature 26.73
158 Mix 15.38
159 Unknown 16.25
160 Retriever, Golden 10.04
161 Unknown 10.66
162 Unknown 32.43
163 Mix 22.49
164 Terrier, West Highland White 40.56
165 Beagle 23.33
166 Chihuahua, Short Coat 21.34
167 Mix 24.19
168 Unknown 11.42
169 Unknown 18.60
170 Unknown 21.34
171 Unknown 20.05
172 Unknown 20.63
173 Unknown 30.40
174 Unknown 14.77
175 Unknown 18.32
176 Unknown 14.27
177 Unknown 32.08
178 Beagle 16.24
179 Retriever, Labrador 10.29
180 Mix 15.47
181 Unknown 22.97
182 Unknown 21.22
183 Unknown 20.15
184 Mix 7.61
185 Unknown 25.73
186 Unknown 18.93
187 Retriever, Labrador 12.23
188 Unknown 23.40
189 Unknown 30.80
190 Unknown 22.82
191 Unknown 13.73
192 Mix 22.04
193 Unknown 4.85
194 Mix 4.77
195 Unknown 4.15
196 Mix 4.69
197 Unknown 4.36
198 Unknown 4.50
199 Unknown 4.51
200 Unknown 4.66
201 Mix 4.70
202 Unknown 4.20
203 Mix 5.10
204 Mix 4.62
205 Unknown 4.31
206 Mix 4.11
207 Unknown 4.89
208 Unknown 4.16
209 Mix 4.44
210 Mix 4.67
211 Unknown 4.13
212 Mix 4.11
213 Unknown 4.18
214 Unknown 4.23
215 American Shorthair 4.73
216 Unknown 3.90
217 Unknown 4.56
218 Mix 4.49
219 Unknown 4.15
220 Mix 4.35
221 Unknown 3.83
222 Unknown 5.29
223 Domestic Shorthair 4.54
224 Unknown 4.49
225 Unknown 4.27
226 Unknown 4.82
227 Unknown 4.37
228 Mix 4.51
229 Unknown 4.71
230 Unknown 4.82
231 Mix 4.60
232 Mix 4.32
233 Mix 4.17
234 Unknown 3.85
235 Mix 4.03
236 Unknown 4.72
237 Mix 4.04
238 Unknown 4.29
239 Unknown 4.30
240 Unknown 28.08
241 Mix 7.36
242 Mix 24.32
243 Unknown 30.96
244 Unknown 23.02
245 Unknown 19.84
246 Unknown 23.40
247 Pug 22.08
248 Mix 28.64
249 Shih Tzu 10.77
250 Dachshund, Standard Smooth Haired 26.25
251 Unknown 7.47
252 Unknown 22.64
253 Bernese Mountain Dog 25.51
254 Samoyed 23.39
255 Unknown 4.64
256 Mix 4.27
257 Unknown 4.60
258 Mix 3.94
259 Unknown 4.18
260 Mix 4.48
261 Mix 4.35
262 Unknown 4.80
263 Mix 3.83
264 Unknown 4.38
265 Chihuahua, Short Coat 25.09
266 Unknown 14.51
267 Poodle, Standard 10.47
268 Unknown 22.88
269 Unknown 8.62
270 Poodle, Standard 32.93
271 German Shepherd 12.82
272 Chow Chow 24.82
273 Unknown 17.96
274 Poodle, Standard 16.95
275 Belgian Malinois 33.44
276 Terrier, Russell 11.83
277 Unknown 24.57
278 Mix 22.63
279 Welsh Corgi, Cardigan 19.55
280 Pomeranian 23.38
281 Unknown 9.53
282 Unknown 20.60
283 Unknown 17.87
284 Unknown 23.45
285 Mix 18.72
286 Unknown 11.68
287 Unknown 19.21
288 Unknown 22.38
289 Mix 19.12
290 Boxer 28.13
291 Mix 32.20
292 Retriever, Golden 24.32
293 Unknown 15.48
294 Pekingese 24.36
295 Mix 20.51
296 Unknown 19.68
297 Unknown 5.41
298 Retriever, Golden 23.49
299 Unknown 16.39
300 Unknown 22.73
301 Unknown 28.30
302 Unknown 24.62
303 Poodle, Standard 15.13
304 Poodle, Miniature 14.34
305 Terrier, Rat 27.45
306 Retriever, Labrador 24.35
307 Unknown 19.68
308 Unknown 26.38
309 Australian Cattle Dog 24.79
310 Unknown 10.74
311 Unknown 15.23
312 Unknown 27.38
313 Retriever, Labrador 16.76
314 Unknown 24.14
315 Unknown 21.88
316 Mix 28.31
317 Mix 17.06
318 Unknown 23.67
319 Unknown 22.14
320 Spaniel, English Springer 25.51
321 Mix 4.12
322 Unknown 4.34
323 Mix 4.81
324 Unknown 4.54
325 Mix 4.96
326 Unknown 4.42
327 Mix 4.40
328 Unknown 4.10
329 Domestic Shorthair 4.00
330 Mix 4.26
331 Unknown 4.87
332 Unknown 4.56
333 Unknown 4.79
334 Unknown 4.75
335 Unknown 4.04
336 Mix 4.57
337 Unknown 4.46
338 Mix 4.57
339 Unknown 4.46
340 Mix 4.77
341 Unknown 4.22
342 Unknown 4.11
343 Mix 4.47
344 Unknown 4.25
345 Mix 4.18
346 Mix 4.53
347 Unknown 3.89
348 Mix 5.02
349 Unknown 4.44
350 Unknown 4.38
351 Unknown 5.08
352 Unknown 4.01
353 Unknown 4.52
354 Mix 18.24
355 Retriever, Labrador 10.21
356 Beagle 23.36
357 Australian Shepherd 22.24
358 Unknown 13.06
359 Unknown 12.49
360 Unknown 23.22
361 Mix 28.85
362 Mix 21.57
363 Mix 16.83
364 Dachshund, Standard Smooth Haired 18.34
365 Unknown 3.54
366 Unknown 34.32
367 Australian Shepherd 21.47
368 Unknown 21.11
369 Unknown 23.11
370 Mix 21.54
371 Weimaraner 14.18
372 Unknown 18.74
373 Poodle, Miniature 21.42
374 Unknown 22.68
375 Pointer, German Shorthaired 20.43
376 Mix 19.01
377 Unknown 24.04
378 Mix 27.95
379 Beagle 23.50
380 Mix 19.07
381 Unknown 22.51
382 Unknown 15.46
383 Chihuahua, Short Coat 14.26
384 Unknown 16.48
385 Unknown 11.96
386 Chihuahua, Short Coat 20.87
387 Unknown 18.41
388 Terrier, Pit Bull 10.10
389 Terrier, Jack Russell 20.92
390 Terrier, Boston 14.64
391 Mix 28.01
392 Mix 23.51
393 Mix 12.36
394 Unknown 20.13
395 Unknown 27.49
396 Mix 24.95
397 Unknown 21.56
398 Pointer, German Shorthaired 17.72
399 Unknown 31.15
400 Australian Shepherd 16.85
401 Mix 23.78
402 Unknown 27.86
403 Mix 8.18
404 Terrier, Jack Russell 32.10
405 Unknown 21.08
406 Shih Tzu 17.89
407 Unknown 5.09
408 Mix 4.56
409 Unknown 4.13
410 Unknown 3.99
411 Unknown 4.41
412 Unknown 4.51
413 Unknown 4.77
414 Mix 5.48
415 Unknown 4.52
416 Unknown 4.93
417 Unknown 4.25
418 Mix 4.60
419 Mix 4.53
420 Mix 4.41
421 Mix 4.02
422 Unknown 4.65
423 Mix 5.07
424 Mix 4.76
425 Unknown 22.11
426 Retriever, Labrador 10.06
427 Unknown 16.26
428 Retriever, Labrador 13.06
429 Mix 23.34
430 Unknown 28.77
431 Unknown 29.30
432 Unknown 11.44
433 Unknown 8.93
434 Retriever, Golden 22.10
435 German Shepherd 21.07
436 Terrier 20.99
437 Shih Tzu 23.35
438 Terrier, American Pit Bull 21.16
439 Unknown 12.29
440 Retriever, Labrador 26.06
441 Unknown 25.41
442 Terrier, American Staffordshire 21.55
443 Mix 17.40
444 Poodle, Miniature 7.72
445 Unknown 16.93
446 Unknown 25.80
447 Shepherd 21.45
448 Unknown 23.26
449 Unknown 21.35
450 Unknown 26.43
451 Unknown 26.53
452 Unknown 13.50
453 Mix 17.16
454 Bichon Frise 20.88
455 Mix 14.24
456 Spaniel 25.94
457 Unknown 21.93
458 Terrier, American Pit Bull 26.52
459 Unknown 8.01
460 Mix 21.38
461 Poodle, Standard 20.17
462 Unknown 12.89
463 Unknown 12.77
464 Mix 24.28
465 Unknown 17.04
466 Unknown 18.42
467 Retriever, Labrador 14.02
468 Old English Sheepdog 23.21
469 Pug 15.82
470 Boxer 23.62
471 Poodle, Standard 26.08
472 Unknown 17.58
473 Dachshund, Miniature Long Haired 26.77
474 Unknown 22.59
475 Poodle, Standard 26.04
476 Beagle 16.66
477 Carolina Dog 17.46
478 Shepherd 17.97
479 Mix 18.59
480 Retriever, Labrador 18.72
481 Poodle, Toy 27.01
482 Unknown 9.13
483 Terrier 25.65
484 Poodle, Miniature 13.84
485 Unknown 18.41
486 Unknown 18.09
487 Unknown 32.69
488 Unknown 4.65
489 Unknown 4.59
490 Unknown 4.77
491 Mix 4.50
492 Unknown 4.39
493 Unknown 4.22
494 Unknown 4.59
495 Mix 4.70
496 Unknown 3.89
497 Unknown 4.74
498 Unknown 4.30
499 Unknown 4.04
500 Unknown 4.74
501 Unknown 5.26
502 Unknown 4.26
503 Unknown 4.13
504 Unknown 4.64
505 Unknown 4.78
506 Mix 3.88
507 Mix 4.47
508 Unknown 5.06
509 Mix 9.58
510 Unknown 21.83
511 Mix 15.48
512 Unknown 17.60
513 Unknown 15.75
514 Unknown 24.02
515 Unknown 23.40
516 Unknown 21.79
517 Mix 26.44
518 Boxer 22.50
519 Retriever, Golden 27.23
520 Unknown 17.02
521 Unknown 19.46
522 Unknown 23.63
523 Unknown 11.29
524 Unknown 18.54
525 Unknown 28.97
526 Unknown 25.30
527 Unknown 20.91
528 Unknown 16.35
529 Unknown 23.56
530 Unknown 21.38
531 Mix 12.84
532 Poodle, Miniature 18.50
533 Unknown 12.00
534 Unknown 11.95
535 Unknown 23.43
536 Unknown 17.22
537 Unknown 4.93
538 Mix 3.86
539 Unknown 4.72
540 Mix 4.92
541 Mix 3.45
542 Unknown 4.59
543 Unknown 4.43
544 Mix 4.38
545 Unknown 26.83
546 Unknown 31.10
547 Unknown 19.34
548 Mix 8.43
549 Mix 11.89
550 Unknown 16.61
551 Mix 31.68
552 Unknown 15.40
553 Unknown 31.17
554 Unknown 20.66
555 Unknown 27.13
556 Poodle, Miniature 18.82
557 Unknown 30.93
558 Unknown 20.54
559 Unknown 21.46
560 Unknown 34.58
561 Unknown 17.02
562 Unknown 25.11
563 Unknown 23.48
564 Dachshund, Miniature Smooth Haired 16.38
565 Unknown 6.68
566 Poodle, Miniature 10.10
567 Unknown 20.45
568 Mix 20.18
569 Unknown 32.11
570 Mix 20.78
571 Poodle, Standard 20.54
572 Poodle, Standard 31.15
573 Retriever, Golden 18.98
574 Mix 15.05
575 Poodle, Miniature 21.84
576 Mix 21.91
577 Mix 19.75
578 Border Collie 26.02
579 Unknown 26.80
580 Unknown 17.85
581 Unknown 28.42
582 Papillon 24.96
583 Unknown 22.39
584 Unknown 4.09
585 Unknown 4.43
586 Mix 4.53
587 Siamese 4.55
588 Unknown 4.55
589 Mix 4.70
590 Unknown 4.38
591 Unknown 3.98
592 Mix 4.16
593 Mix 4.86
594 Unknown 4.53
595 Mix 4.62
596 Mix 4.17
597 Mix 4.78
598 Mix 4.27
599 Mix 4.33
600 Mix 4.58
601 Unknown 4.91
602 Mix 4.76
603 Mix 4.75
604 Maine Coon 4.10
605 Unknown 4.48
606 Mix 25.63
607 Unknown 25.87
608 Unknown 25.33
609 Border Collie 7.56
610 Unknown 28.87
611 Mix 23.30
612 Unknown 21.81
613 Unknown 11.88
614 Unknown 7.82
615 Mix 18.14
616 Unknown 11.51
617 Unknown 9.47
618 Unknown 12.91
619 Poodle, Standard 7.14
620 Unknown 8.46
621 Unknown 16.67
622 Mix 12.51
623 Mix 25.43
624 Spaniel, American Cocker 15.52
625 Unknown 16.40
626 Unknown 29.18
627 Mix 8.45
628 Alaskan Husky 12.70
629 Unknown 19.11
630 Hound 24.69
631 Mix 17.77
632 Mix 20.02
633 Unknown 26.88
634 Poodle, Standard 21.80
635 Unknown 23.30
636 Poodle, Standard 14.57
637 Unknown 20.19
638 Mix 18.46
639 Unknown 24.75
640 Alaskan Malamute 14.19
641 Mix 18.09
642 Unknown 29.09
643 Unknown 10.37
644 Chihuahua, Short Coat 21.53
645 Unknown 17.30
646 Mix 4.65
647 Unknown 4.46
648 Mix 4.47
649 Unknown 4.58
650 Mix 4.86
651 Mix 4.41
652 Mix 4.44
653 Mix 4.44
654 Mix 4.51
655 Mix 4.38
656 Unknown 5.05
657 Unknown 4.10
658 Unknown 4.61
659 Mix 4.15
660 Unknown 4.12
661 Mix 4.21
662 Unknown 4.38
663 Domestic Medium Hair 4.85
664 Mix 4.14
665 Unknown 4.32
666 Unknown 3.83
667 Unknown 4.34
668 Mix 4.60
669 Unknown 4.58
670 Unknown 4.37
671 Siamese 4.44
672 Mix 4.68
673 Unknown 4.82
674 Ragdoll 4.42
675 Unknown 4.90
676 Unknown 4.15
677 Mix 20.20
678 Unknown 23.39
679 Unknown 15.08
680 Unknown 30.09
681 Unknown 25.00
682 Terrier, Fox, Smooth 20.45
683 Australian Shepherd 21.56
684 Mix 22.26
685 Unknown 26.12
686 Poodle, Toy 19.05
687 Terrier, American Pit Bull 22.01
688 Unknown 7.42
689 Mix 17.47
690 Unknown 14.02
691 Border Collie 8.44
692 Unknown 20.30
693 Chihuahua, Long Coat 9.33
694 Unknown 28.73
695 Poodle, Miniature 25.58
696 Miniature Pinscher 12.67
697 Unknown 15.83
698 Poodle, Standard 29.32
699 Unknown 11.51
700 Unknown 13.52
701 Unknown 20.01
702 Poodle, Miniature 29.00
703 Unknown 16.78
704 Unknown 17.72
705 Unknown 15.12
706 Unknown 17.62
707 Siberian Husky 13.40
708 Mix 13.15
709 Unknown 21.33
710 Unknown 27.66
711 Poodle, Miniature 24.19
712 Unknown 22.22
713 Terrier, Jack Russell 21.52
714 Unknown 27.78
715 Poodle, Miniature 21.78
716 Unknown 24.12
717 Unknown 13.78
718 Unknown 10.59
719 Miniature Pinscher 17.48
720 Unknown 22.83
721 Unknown 11.27
722 German Shepherd 22.05
723 Unknown 12.18
724 Unknown 15.97
725 Border Collie 18.05
726 Border Collie 19.03
727 Mix 24.18
728 Chihuahua, Short Coat 24.89
729 Unknown 22.35
730 Mix 30.69
731 Schnauzer, Miniature 16.13
732 Unknown 16.84
733 Poodle, Miniature 25.17
734 Mix 25.20
735 Miniature Pinscher 15.95
736 Unknown 18.06
737 Unknown 20.36
738 Unknown 16.91
739 Italian Greyhound 16.14
740 Unknown 24.85
741 Retriever, Labrador 21.65
742 Poodle, Miniature 18.64
743 Unknown 13.69
744 Poodle, Standard 28.10
745 Mix 19.79
746 Unknown 21.79
747 Unknown 10.71
748 Unknown 23.93
749 Unknown 14.82
750 Poodle, Standard 9.67
751 Rottweiler 21.40
752 Unknown 11.73
753 Mix 24.74
754 Terrier, American Pit Bull 13.61
755 Unknown 12.96
756 Mix 19.53
757 Mix 23.73
758 Hound 14.81
759 Unknown 13.58
760 Mix 23.99
761 Poodle, Standard 29.05
762 Mix 23.43
763 Unknown 26.38
764 Unknown 12.10
765 Unknown 17.06
766 Unknown 12.57
767 Mix 22.78
768 Unknown 14.83
769 Poodle, Standard 5.41
770 Poodle, Standard 21.99
771 Unknown 4.83
772 Mix 3.93
773 Unknown 4.75
774 Unknown 4.24
775 Unknown 4.45
776 Unknown 4.08
777 Unknown 4.42
778 Unknown 4.63
779 Mix 4.35
780 Unknown 4.77
781 Unknown 4.25
782 Unknown 4.88
783 Unknown 4.49
784 Mix 4.27
785 Mix 4.78
786 Unknown 4.28
787 Unknown 4.58
788 Unknown 4.95
789 Unknown 4.32
790 Unknown 3.78
791 Unknown 4.07
792 Unknown 4.12
793 Unknown 4.43
794 Unknown 4.42
795 Mix 4.38
796 Unknown 4.55
797 Unknown 4.32
798 Unknown 4.69
799 Unknown 4.14
800 Unknown 3.92
801 Unknown 4.78
802 Unknown 4.84
803 Unknown 5.10
804 Unknown 4.24
805 Mix 4.63
806 Unknown 4.72
807 Mix 4.83
808 Mix 4.82
809 Unknown 4.51
810 Unknown 4.63
811 Mix 3.84
812 Mix 4.14
813 Unknown 5.06
814 Siamese 4.34
815 Mix 4.40
816 Unknown 4.76
817 Mix 5.29
818 Unknown 4.45
819 Unknown 24.25
820 Unknown 17.50
821 Unknown 26.84
822 Unknown 19.78
823 Unknown 13.39
824 Unknown 26.48
825 Unknown 19.41
826 Unknown 13.56
827 Unknown 16.72
828 Unknown 10.03
829 Mix 23.56
830 Unknown 21.96
831 Mix 10.00
832 Unknown 31.37
833 Mix 30.47
834 Unknown 14.88
835 Mix 8.33
836 Unknown 20.49
837 Unknown 15.32
838 Terrier, Jack Russell 21.06
839 Mix 11.63
840 Unknown 18.70
841 Mix 23.43
842 Unknown 20.19
843 Pug 7.22
844 Unknown 15.46
845 Terrier, Yorkshire 10.53
846 Siberian Husky 18.33
847 Siberian Husky 18.16
848 Mix 10.16
849 Poodle, Miniature 25.57
850 Unknown 27.53
851 Unknown 26.56
852 Unknown 25.55
853 Unknown 14.66
854 Poodle, Standard 19.90
855 Unknown 30.14
856 Unknown 31.54
857 Unknown 28.83
858 Unknown 22.66
859 Poodle, Miniature 23.40
860 Unknown 17.86
861 Unknown 35.45
862 Unknown 20.23
863 Unknown 16.04
864 Mix 26.92
865 Mix 30.81
866 Unknown 21.70
867 Unknown 19.04
868 Mix 21.05
869 Unknown 30.99
870 Unknown 24.11
871 Unknown 21.95
872 Poodle, Standard 17.09
873 Griffon, Brussels 19.07
874 Unknown 17.45
875 German Shepherd 26.18
876 Schnauzer, Standard 18.47
877 Unknown 22.95
878 Pomeranian 17.74
879 Poodle, Miniature 23.43
880 Rottweiler 32.68
881 Unknown 20.93
882 Unknown 17.33
883 Poodle, Standard 30.28
884 Mix 15.71
885 Mix 4.46
886 Unknown 4.56
887 Unknown 4.43
888 Maine Coon 5.28
889 Unknown 3.98
890 Maine Coon 4.64
891 Unknown 4.71
892 Unknown 4.87
893 Unknown 4.30
894 Mix 4.73
895 Siamese 4.88
896 Mix 3.96
897 Mix 4.57
898 Unknown 4.45
899 Unknown 4.76
900 Unknown 4.05
901 Unknown 4.53
902 Mix 4.73
903 Unknown 4.38
904 Domestic Shorthair 4.70
905 Unknown 4.91
906 Unknown 4.61
907 Unknown 4.64
908 Unknown 4.33
909 Unknown 4.30
910 Unknown 4.44
911 Mix 4.50
912 Unknown 5.15
913 Mix 4.42
914 Unknown 4.38
915 Unknown 4.91
916 Mix 4.28
917 Unknown 3.93
918 Unknown 4.63
919 Norwegian Forest 4.62
920 Unknown 3.93
921 Mix 4.82
922 Mix 4.58
923 Unknown 4.48
924 Mix 19.94
925 Unknown 17.44
926 Unknown 24.57
927 Mix 6.08
928 Poodle, Standard 28.20
929 Unknown 29.96
930 Unknown 12.50
931 Poodle, Standard 7.71
932 Mix 8.54
933 Unknown 33.56
934 Mix 24.72
935 Unknown 14.81
936 Hound 14.89
937 Unknown 24.58
938 Griffon, Brussels 23.08
939 Great Pyrenees 15.23
940 Unknown 24.67
941 Poodle, Miniature 13.76
942 Unknown 21.26
943 Terrier 22.93
944 Unknown 19.84
945 Unknown 34.52
946 Terrier, Yorkshire 17.24
947 Unknown 23.60
948 Mix 22.69
949 Mix 13.95
950 Belgian Sheepdog 22.22
951 Australian Cattle Dog 18.36
952 Unknown 12.20
953 Unknown 16.99
954 Unknown 14.12
955 Spaniel, English Cocker 13.50
956 Chihuahua, Short Coat 14.66
957 Unknown 37.12
958 Retriever, Labrador 27.61
959 Unknown 15.98
960 Unknown 24.94
961 Poodle, Standard 21.94
962 Unknown 25.62
963 Unknown 9.97
964 Bulldog, American 21.42
965 Mix 17.15
966 Poodle, Standard 19.75
967 Unknown 16.37
968 Unknown 24.56
969 Bulldog, American 22.67
970 Unknown 18.86
971 Mix 16.01
972 Unknown 16.24
973 Unknown 20.87
974 Poodle, Toy 20.36
975 Mix 24.36
976 Mix 24.17
977 Mix 23.87
978 Unknown 31.15
979 Unknown 21.55
980 Unknown 28.85
981 Unknown 17.67
982 Unknown 15.28
983 Poodle, Miniature 25.89
984 Unknown 22.87
985 Unknown 19.96
986 Spaniel, American Cocker 33.22
987 Welsh Corgi, Cardigan 22.00
988 Unknown 27.30
989 Dachshund, Miniature Smooth Haired 31.63
990 Unknown 32.20
991 Unknown 30.91
992 Mix 26.02
993 Poodle, Standard 25.69
994 Mix 20.89
995 Unknown 20.05
996 Terrier, Yorkshire 25.15
997 Unknown 36.38
998 Poodle, Miniature 21.12
999 Unknown 19.12
1000 Mix 7.34
1001 Unknown 15.45
1002 Unknown 28.59
1003 Terrier, Staffordshire Bull 22.52
1004 Unknown 24.26
1005 Retriever, Labrador 15.39
1006 Coonhound, Treeing Walker 18.99
1007 Mix 15.76
1008 Terrier, Boston 20.90
1009 Unknown 11.89
1010 Unknown 24.95
1011 Mix 11.18
1012 Maltese 23.10
1013 Poodle, Miniature 14.55
1014 Retriever, Labrador 34.63
1015 Unknown 17.98
1016 Unknown 28.74
1017 Unknown 23.11
1018 Unknown 17.73
1019 Mix 19.22
1020 Unknown 21.11
1021 Unknown 15.58
1022 Unknown 20.24
1023 Unknown 16.02
1024 Unknown 23.52
1025 Unknown 21.44
1026 Unknown 17.12
1027 Mix 23.68
1028 Retriever 22.36
1029 Border Collie 19.95
1030 Retriever, Flat-Coated 13.73
1031 Unknown 16.14
1032 Mix 23.53
1033 Unknown 15.78
1034 Unknown 26.99
1035 Unknown 17.97
1036 Retriever, Golden 25.63
1037 Unknown 24.43
1038 Unknown 14.73
1039 Boxer 12.18
1040 Mix 4.38
1041 Unknown 4.74
1042 Mix 4.51
1043 Maine Coon 4.43
1044 Unknown 4.73
1045 Mix 4.63
1046 Unknown 4.73
1047 Unknown 4.24
1048 Unknown 4.34
1049 Unknown 4.75
1050 Unknown 4.16
1051 Mix 4.29
1052 Mix 4.64
1053 Mix 4.53
1054 Unknown 3.93
1055 Mix 4.57
1056 Unknown 4.20
1057 Unknown 4.44
1058 Unknown 3.97
1059 Unknown 4.04
1060 Unknown 4.30
1061 Mix 4.45
1062 Unknown 4.63
1063 Unknown 4.97
1064 Unknown 4.02
1065 Mix 4.21
1066 Mix 4.35
1067 Unknown 4.80
1068 Mix 4.07
1069 Unknown 4.13
1070 Unknown 4.70
1071 Mix 4.70
1072 Unknown 4.73
1073 Unknown 4.73
1074 Unknown 4.85
1075 Unknown 4.63
1076 Unknown 4.59
1077 Unknown 4.11
1078 Unknown 4.60
1079 Unknown 4.28
1080 Unknown 4.45
1081 Unknown 4.40
1082 Unknown 4.90
1083 Unknown 5.15
1084 Unknown 4.84
1085 Balinese 4.40
1086 Unknown 4.46
1087 Mix 4.99
1088 Chihuahua, Long Coat 20.54
1089 Unknown 14.71
1090 Poodle, Standard 33.69
1091 Beagle 21.76
1092 Unknown 11.51
1093 Unknown 11.03
1094 Chihuahua, Long Coat 19.10
1095 Unknown 25.29
1096 Unknown 12.65
1097 Beagle 21.31
1098 Poodle, Standard 21.41
1099 Unknown 23.73
1100 Mix 4.50
1101 Unknown 23.02
1102 Mix 14.93
1103 Miniature Pinscher 22.16
1104 Border Collie 18.06
1105 Mix 20.35
1106 Unknown 22.50
1107 Unknown 19.42
1108 Unknown 23.44
1109 Unknown 14.48
1110 Mix 17.62
1111 Unknown 27.34
1112 Terrier 34.65
1113 Mix 27.95
1114 Unknown 25.88
1115 Border Collie 11.04
1116 Terrier 19.92
1117 Mix 21.10
1118 Unknown 17.60
1119 Mix 14.73
1120 Terrier, American Pit Bull 19.01
1121 Mix 30.39
1122 Unknown 16.56
1123 Pointer 25.03
1124 Pug 3.79
1125 German Shepherd 32.09
1126 Unknown 0.39
1127 Unknown 19.14
1128 Greyhound 5.18
1129 Retriever, Labrador 19.74
1130 Shepherd 20.42
1131 Mastiff 10.28
1132 Mix 16.34
1133 Mix 24.21
1134 Mix 24.38
1135 Unknown 11.78
1136 Unknown 21.82
1137 Chow Chow 17.20
1138 Mix 8.62
1139 Mix 10.54
1140 Retriever, Labrador 13.63
1141 Siberian Husky 21.79
1142 Poodle, Standard 28.11
1143 Mix 30.71
1144 Unknown 30.10
1145 Beagle 20.13
1146 Unknown 18.18
1147 Unknown 14.98
1148 Unknown 7.73
1149 Mix 13.40
1150 Unknown 7.57
1151 Mix 18.88
1152 Bernese Mountain Dog 17.96
1153 Unknown 22.03
1154 Unknown 27.64
1155 Unknown 22.80
1156 Unknown 22.34
1157 Australian Cattle Dog 25.79
1158 Alaskan Malamute 10.28
1159 Australian Shepherd 16.57
1160 Bichon Frise 25.88
1161 Chihuahua, Short Coat 14.41
1162 Unknown 4.34
1163 Unknown 4.72
1164 Unknown 4.40
1165 Unknown 4.31
1166 Mix 3.52
1167 Unknown 3.83
1168 Unknown 5.20
1169 Unknown 4.44
1170 Unknown 5.03
1171 Unknown 4.51
1172 Mix 4.24
1173 Mix 4.67
1174 Unknown 4.61
1175 Mix 4.55
1176 Unknown 4.90
1177 Unknown 4.69
1178 Unknown 4.46
1179 Unknown 4.45
1180 Unknown 4.62
1181 Unknown 4.29
1182 Unknown 5.02
1183 Unknown 4.63
1184 Unknown 4.06
1185 Unknown 15.72
1186 Mix 21.47
1187 Unknown 29.14
1188 Mix 22.16
1189 Unknown 23.77
1190 Mix 22.16
1191 Unknown 15.12
1192 Unknown 21.25
1193 Unknown 17.95
1194 Unknown 27.01
1195 Mix 21.79
1196 Mix 16.31
1197 Unknown 18.47
1198 Unknown 12.29
1199 Unknown 21.06
1200 Chihuahua, Long Coat 21.21
1201 Poodle, Standard 24.12
1202 Unknown 28.28
1203 Unknown 29.54
1204 Unknown 20.80
1205 Mix 14.19
1206 Unknown 9.77
1207 Mix 21.12
1208 Unknown 19.87
1209 Unknown 18.99
1210 Unknown 21.03
1211 Unknown 12.76
1212 Unknown 31.17
1213 Unknown 18.14
1214 Australian Shepherd 12.79
1215 Unknown 28.40
1216 Unknown 25.29
1217 Mix 18.84
1218 Mix 19.25
1219 Dachshund, Standard Smooth Haired 27.33
1220 Unknown 16.42
1221 Unknown 20.86
1222 Unknown 25.73
1223 Beagle 18.08
1224 Unknown 25.71
1225 Mix 26.59
1226 Shih Tzu 22.61
1227 Unknown 12.11
1228 Dachshund, Standard Smooth Haired 1.20
1229 Unknown 10.10
1230 Poodle, Standard 14.10
1231 Mix 26.17
1232 Mix 19.46
1233 Unknown 14.58
1234 Unknown 14.62
1235 Unknown 20.71
1236 Unknown 14.12
1237 Unknown 31.59
1238 Siberian Husky 19.72
1239 Unknown 33.07
1240 Poodle, Standard 15.97
1241 Poodle, Standard 9.66
1242 Unknown 4.41
1243 Unknown 4.43
1244 Unknown 4.70
1245 Mix 4.27
1246 Unknown 5.05
1247 Unknown 4.46
1248 Mix 4.77
1249 Mix 4.67
1250 Mix 4.36
1251 Unknown 4.26
1252 Unknown 4.87
1253 Unknown 4.85
1254 Domestic Shorthair 4.64
1255 Mix 5.00
1256 Unknown 4.58
1257 Unknown 4.59
1258 Unknown 4.64
1259 Unknown 4.35
1260 Mix 4.16
1261 American Shorthair 4.06
1262 Mix 4.47
1263 Unknown 4.46
1264 Unknown 4.86
1265 Mix 4.65
1266 Unknown 4.31
1267 Mix 4.70
1268 Unknown 26.56
1269 Terrier 20.74
1270 Unknown 19.54
1271 Unknown 24.46
1272 Mix 22.67
1273 Unknown 23.54
1274 Retriever, Labrador 26.74
1275 Unknown 21.38
1276 Spaniel 26.15
1277 Mix 33.45
1278 Unknown 24.62
1279 Mix 29.08
1280 Unknown 19.10
1281 Spaniel 24.96
1282 Unknown 14.65
1283 Basset Hound 21.78
1284 Unknown 19.87
1285 Terrier 12.98
1286 Retriever, Labrador 26.26
1287 Dachshund, Standard Smooth Haired 13.28
1288 Unknown 26.91
1289 Pug 17.96
1290 Unknown 14.67
1291 Siberian Husky 8.43
1292 Unknown 17.26
1293 Beagle 15.84
1294 Mix 3.96
1295 Unknown 3.91
1296 Ragdoll 4.38
1297 Mix 4.68
1298 Unknown 4.71
1299 Mix 4.58
1300 Mix 3.79
1301 Unknown 4.76
1302 Mix 4.67
1303 Unknown 4.55
1304 Mix 4.34
1305 Unknown 4.56
1306 Mix 20.06
1307 Poodle, Standard 25.84
1308 Unknown 18.33
1309 Unknown 17.74
1310 Unknown 23.97
1311 Unknown 29.22
1312 Cur, Black-Mouth 13.12
1313 Unknown 10.79
1314 Hound 21.51
1315 Terrier 32.09
1316 Unknown 21.27
1317 Basset Hound 26.36
1318 Poodle, Standard 24.38
1319 Chihuahua, Short Coat 26.64
1320 Unknown 18.86
1321 Unknown 20.69
1322 Terrier, Yorkshire 16.82
1323 Unknown 12.24
1324 Unknown 19.23
1325 Poodle, Miniature 17.02
1326 Hound 17.23
1327 Unknown 22.82
1328 Basset Hound 23.48
1329 Unknown 17.42
1330 Unknown 18.89
1331 Mix 28.17
1332 Unknown 18.43
1333 Welsh Corgi, Cardigan 13.21
1334 Unknown 25.17
1335 Poodle, Miniature 7.20
1336 Mix 19.81
1337 Poodle, Miniature 19.27
1338 Mastiff 2.32
1339 Border Collie 9.24
1340 Terrier, Pit Bull 16.13
1341 Lhasa Apso 20.02
1342 Unknown 33.18
1343 American Eskimo 14.41
1344 Terrier, Rat 21.18
1345 Unknown 6.71
1346 Poodle, Standard 19.32
1347 Great Pyrenees 15.54
1348 Unknown 23.91
1349 Terrier, American Pit Bull 7.33
1350 German Shepherd 37.76
1351 Unknown 24.22
1352 Unknown 23.80
1353 Unknown 30.51
1354 German Shepherd 30.41
1355 Alaskan Husky 24.76
1356 Siberian Husky 25.17
1357 Unknown 25.99
1358 Unknown 15.55
1359 Unknown 21.97
1360 Mix 27.01
1361 Mix 13.35
1362 Mix 25.25
1363 Unknown 20.99
1364 Mix 23.06
1365 Australian Shepherd 19.18
1366 Unknown 27.02
1367 Unknown 28.25
1368 Unknown 26.10
1369 Unknown 24.56
1370 Mix 20.57
1371 Siamese 4.67
1372 Unknown 4.33
1373 Mix 4.26
1374 Unknown 4.39
1375 Unknown 4.48
1376 Unknown 4.47
1377 Unknown 4.93
1378 Unknown 4.76
1379 Unknown 4.37
1380 Unknown 4.53
1381 Unknown 4.59
1382 Unknown 4.56
1383 Unknown 4.29
1384 Unknown 4.60
1385 Mix 4.55
1386 Unknown 5.03
1387 Unknown 4.31
1388 Mix 4.13
1389 Unknown 4.76
1390 Unknown 4.49
1391 Mix 4.25
1392 Unknown 5.11
1393 Unknown 4.41
1394 Unknown 4.50
1395 Unknown 4.41
1396 Unknown 4.90
1397 Unknown 4.10
1398 Unknown 4.80
1399 Turkish Angora 4.51
1400 Mix 4.57
1401 Unknown 17.07
1402 German Shepherd 21.32
1403 Mix 14.70
1404 Unknown 19.08
1405 Unknown 23.29
1406 Unknown 14.53
1407 Chihuahua, Long Coat 23.65
1408 Unknown 15.12
1409 Unknown 19.27
1410 Mix 31.25
1411 Terrier, Pit Bull 24.98
1412 Unknown 22.40
1413 Chow Chow 22.34
1414 Mix 29.43
1415 Mix 14.84
1416 Rottweiler 28.14
1417 Unknown 24.84
1418 Mix 28.27
1419 Unknown 17.16
1420 Unknown 16.86
1421 Unknown 33.42
1422 Unknown 16.72
1423 Unknown 21.97
1424 Unknown 10.70
1425 Schipperke 9.33
1426 Border Collie 22.93
1427 Mix 23.00
1428 Unknown 17.74
1429 Unknown 20.05
1430 Terrier, Yorkshire 24.17
1431 Unknown 23.57
1432 Unknown 16.73
1433 Rottweiler 28.78
1434 Unknown 20.43
1435 Unknown 14.47
1436 Unknown 20.94
1437 Retriever, Labrador 24.17
1438 Unknown 21.36
1439 Mix 25.00
1440 Mix 28.55
1441 Retriever, Labrador 26.53
1442 Poodle, Standard 16.65
1443 Cur, Black-Mouth 24.99
1444 Unknown 18.34
1445 Unknown 29.33
1446 Unknown 25.26
1447 Hound 21.89
1448 Mix 14.99
1449 Mix 20.27
1450 Mix 25.32
1451 Retriever, Labrador 16.36
1452 Poodle, Miniature 18.00
1453 Mix 19.56
1454 Unknown 1.94
1455 Great Dane 14.93
1456 Mix 23.77
1457 Unknown 11.74
1458 Chihuahua, Short Coat 18.49
1459 Mix 14.65
1460 Schnauzer, Miniature 22.44
1461 Poodle, Standard 24.59
1462 Unknown 19.96
1463 Miniature Pinscher 26.02
1464 Poodle, Standard 23.77
1465 Unknown 20.53
1466 German Shepherd 27.13
1467 Mix 14.11
1468 Unknown 21.47
1469 Boxer 16.24
1470 Unknown 21.23
1471 Mix 17.06
1472 Mix 19.47
1473 Unknown 34.22
1474 Mix 7.70
1475 Mix 4.48
1476 Unknown 4.92
1477 Unknown 4.35
1478 Unknown 4.40
1479 Unknown 4.26
1480 Mix 4.73
1481 Unknown 4.58
1482 Unknown 4.32
1483 Mix 5.09
1484 Mix 5.04
1485 Unknown 4.49
1486 Unknown 4.42
1487 Unknown 4.83
1488 Mix 4.47
1489 Unknown 4.76
1490 Unknown 4.54
1491 Unknown 4.48
1492 Unknown 5.19
1493 Unknown 4.52
1494 Unknown 4.56
1495 Mix 4.51
1496 Unknown 4.45
1497 Unknown 4.27
1498 Mix 4.14
1499 Unknown 4.48
1500 Unknown 4.48
1501 Unknown 4.62
1502 Unknown 4.21
1503 Mix 4.42
1504 Unknown 4.89
1506 Unknown 17.06
1507 Unknown 19.16
1508 Mix 25.68
1509 Unknown 6.65
1510 Mix 21.42
1511 Retriever, Labrador 24.56
1512 Unknown 20.08
1513 Unknown 16.14
1514 Boxer 27.74
1515 Rhodesian Ridgeback 10.95
1516 Cur, Mountain 15.26
1517 Unknown 18.64
1518 Unknown 29.88
1519 Unknown 23.65
1520 Mix 14.06
1521 Unknown 20.75
1522 Unknown 9.12
1523 Rottweiler 24.56
1524 Unknown 26.49
1525 Unknown 21.38
1526 Poodle, Miniature 19.24
1527 Australian Shepherd 17.20
1528 Retriever, Labrador 23.88
1529 Mix 21.69
1530 Bichon Frise 17.36
1531 Unknown 11.05
1532 Unknown 8.02
1533 Terrier, Jack Russell 27.13
1534 Retriever, Labrador 24.38
1535 Unknown 18.88
1536 Unknown 24.70
1537 Spaniel, American Cocker 25.59
1538 Mix 15.06
1539 Unknown 19.59
1540 Terrier, American Pit Bull 14.90
1541 Unknown 22.26
1542 Unknown 5.27
1543 Unknown 16.18
1544 Australian Shepherd 21.33
1545 Unknown 14.91
1546 Unknown 16.94
1547 Unknown 25.25
1548 Unknown 27.66
1549 Beagle 11.23
1550 Mix 24.27
1551 Mix 27.93
1552 Retriever, Labrador 22.25
1553 Unknown 23.62
1554 Unknown 23.07
1555 Beagle 27.54
1556 Dalmatian 17.37
1557 Mix 28.15
1558 Mix 30.79
1559 Unknown 16.33
1560 Dachshund, Miniature Smooth Haired 6.34
1561 Unknown 4.27
1562 Mix 4.09
1563 Unknown 4.69
1564 Mix 4.47
1565 Unknown 4.04
1566 Unknown 4.55
1567 Unknown 4.49
1568 Unknown 5.17
1569 Mix 4.63
1570 Unknown 3.78
1571 Unknown 4.24
1572 Mix 4.55
1573 Unknown 4.22
1574 Unknown 3.89
1575 Unknown 4.79
1576 Mix 4.74
1577 Unknown 3.89
1578 Unknown 4.81
1579 Mix 4.68
1580 Unknown 4.35
1581 Unknown 4.68
1582 Unknown 5.40
1583 Mix 4.10
1584 Unknown 4.54
1585 Unknown 4.54
1586 Mix 4.38
1587 Mix 4.54
1588 Unknown 4.30
1589 Mix 4.51
1590 Unknown 4.75
1591 Unknown 26.08
1592 Unknown 22.50
1593 Unknown 13.42
1594 Poodle, Miniature 13.58
1595 Mix 22.48
1596 Pointer, German Shorthaired 26.58
1597 Unknown 14.56
1598 Unknown 21.50
1599 Terrier 17.07
1600 Spaniel 18.52
1601 Mix 20.92
1602 Unknown 11.46
1603 Unknown 12.21
1604 German Shepherd 17.07
1605 Unknown 20.78
1606 Boxer 15.68
1607 Mix 30.19
1608 Unknown 16.53
1609 Mix 25.15
1610 Mix 31.17
1611 Unknown 30.54
1612 Mix 17.72
1613 Unknown 21.90
1614 Unknown 21.57
1615 Poodle, Miniature 20.67
1616 Unknown 20.98
1617 Mix 15.41
1618 Unknown 27.65
1619 Mix 25.92
1620 Unknown 25.80
1621 German Shepherd 26.18
1622 Mix 17.52
1623 Unknown 12.47
1624 Unknown 24.01
1625 Poodle, Standard 14.78
1626 Unknown 15.51
1627 Unknown 17.20
1628 Unknown 28.17
1629 Poodle, Miniature 19.77
1630 Unknown 4.01
1631 Unknown 3.76
1632 Unknown 4.34
1633 Unknown 4.73
1634 Unknown 4.71
1635 Unknown 4.17
1636 Unknown 4.71
1637 Unknown 4.10
1638 Unknown 4.34
1639 Mix 4.53
1640 Mix 5.02
1641 Unknown 4.57
1642 Maine Coon 4.35
1643 Mix 4.34
1644 Mix 4.79
1645 Mix 5.04
1646 Unknown 4.28
1647 Unknown 4.35
1648 Unknown 4.74
1649 Mix 4.58
1650 Mix 4.42
1651 Unknown 4.78
1652 Mix 4.24
1653 Unknown 4.32
1654 Unknown 4.16
1656 Unknown 17.29
1657 Poodle, Miniature 24.03
1658 Terrier, Airedale 21.94
1659 Mix 19.15
1660 Mix 23.96
1661 Unknown 38.61
1662 Unknown 17.72
1663 Unknown 19.16
1664 Basset Hound 18.35
1665 Unknown 27.08
1666 Retriever, Labrador 11.78
1667 Unknown 21.61
1668 Mix 22.18
1669 Unknown 21.97
1670 Unknown 14.92
1671 Unknown 13.99
1672 Unknown 19.88
1673 Border Collie 22.10
1674 Chihuahua, Short Coat 13.04
1675 Retriever, Labrador 18.51
1676 Mix 18.61
1677 Poodle, Standard 16.87
1678 Mix 25.50
1679 Spaniel, American Cocker 21.50
1680 Pomeranian 16.44
1681 Shepherd 30.16
1682 Retriever 13.45
1683 Mix 19.83
1684 Poodle, Standard 24.20
1685 Poodle, Miniature 17.24
1686 Unknown 16.92
1687 Poodle, Standard 12.41
1688 Mix 13.64
1689 Unknown 25.30
1690 Unknown 15.61
1691 Mix 13.95
1692 Unknown 30.90
1693 Unknown 22.04
1694 Unknown 21.32
1695 Unknown 18.42
1696 Unknown 28.02
1697 Mix 15.94
1698 Mix 30.53
1699 Unknown 25.29
1700 Unknown 25.92
1701 Unknown 5.02
1702 Unknown 4.79
1703 Unknown 4.53
1704 Unknown 4.16
1705 Unknown 4.64
1706 Unknown 4.75
1707 Unknown 5.01
1708 Unknown 4.76
1709 Unknown 4.35
1710 Unknown 4.18
1711 Mix 4.10
1712 Mix 4.02
1713 Unknown 4.99
1714 Unknown 4.43
1715 Unknown 4.29
1716 Unknown 4.63
1717 Unknown 4.64
1718 Domestic Medium Hair 5.04
1719 Unknown 4.49
1720 Unknown 4.76
1721 Unknown 15.95
1722 Bichon Frise 29.43
1723 Welsh Corgi, Pembroke 25.95
1724 German Shepherd 23.90
1725 Mix 32.05
1726 Mix 20.11
1727 Mix 20.60
1728 Rottweiler 21.68
1729 Unknown 27.93
1730 Unknown 26.15
1731 Mix 20.10
1732 Unknown 16.97
1733 Mix 21.37
1734 Unknown 24.97
1735 Unknown 19.64
1736 Unknown 29.03
1737 American Blue Heeler 13.85
1738 Unknown 18.38
1739 Mix 28.38
1740 Unknown 16.06
1741 Poodle, Miniature 18.16
1742 Unknown 12.33
1743 Terrier 14.32
1744 Unknown 17.03
1745 Unknown 24.24
1746 Unknown 20.18
1747 Unknown 15.45
1748 Unknown 26.28
1749 Bernese Mountain Dog 16.76
1750 Unknown 29.74
1751 Unknown 18.16
1752 Poodle, Standard 35.21
1753 Mix 12.14
1754 Unknown 21.41
1755 Unknown 26.74
1756 Unknown 17.66
1757 Poodle, Standard 30.42
1758 Unknown 20.17
1759 Poodle, Standard 17.02
1760 Setter, Irish 17.85
1761 Chihuahua, Short Coat 20.59
1762 Unknown 3.74
1763 Unknown 4.35
1764 Mix 4.82
1765 Mix 4.85
1766 Mix 4.46
1767 Unknown 4.47
1768 Unknown 4.11
1769 Mix 4.01
1770 Mix 4.64
1771 Tiffany 4.05
1772 Unknown 4.36
1773 Unknown 4.70
1774 Unknown 4.35
1775 Unknown 4.44
1776 Mix 4.61
1777 Mix 3.95
1778 Unknown 5.02
1779 Collie, Rough 23.88
1780 Unknown 26.31
1781 Unknown 14.37
1782 Unknown 27.09
1783 Unknown 22.41
1784 Unknown 24.65
1785 Boxer 21.61
1786 Unknown 33.16
1787 Great Dane 22.85
1788 Unknown 25.64
1789 Unknown 13.98
1790 Unknown 26.50
1791 Mix 4.42
1792 Mix 4.59
1793 Unknown 5.18
1794 Unknown 4.11
1795 Unknown 4.61
1796 Unknown 4.23
1797 Unknown 5.27
1798 Unknown 18.95
1799 Australian Cattle Dog 29.81
1800 Unknown 19.06
1801 Unknown 7.77
1802 Poodle, Miniature 9.47
1803 Unknown 23.10
1804 Australian Shepherd 13.70
1805 Unknown 18.78
1806 Australian Shepherd 21.36
1807 Unknown 31.02
1808 Unknown 2.55
1809 Unknown 9.96
1810 Mix 21.45
1811 Unknown 17.40
1812 Unknown 20.82
1813 Mix 22.33
1814 Unknown 14.33
1815 Siberian Husky 27.04
1816 Mix 23.44
1817 Unknown 24.20
1818 Bichon Frise 25.24
1819 Papillon 11.23
1820 Mix 22.48
1821 Unknown 17.35
1822 Spaniel, Welsh Springer 19.09
1823 Poodle, Miniature 23.44
1824 Poodle, Standard 20.65
1825 Unknown 12.06
1826 Unknown 20.26
1827 Mix 4.66
1828 Unknown 4.26
1829 Unknown 4.59
1830 Mix 4.77
1831 Unknown 4.47
1832 Unknown 4.00
1833 Unknown 4.40
1834 Unknown 4.58
1835 Unknown 4.55
1836 Mix 4.46
1837 Unknown 4.59
1838 Mix 4.22
1839 Unknown 3.92
1840 Unknown 4.21
1841 Alaskan Husky 21.90
1842 Unknown 28.26
1843 Unknown 12.77
1844 Mix 11.39
1845 Dachshund, Miniature Smooth Haired 23.21
1846 Unknown 31.45
1847 Spaniel, American Cocker 18.90
1848 Unknown 27.85
1849 Mix 17.06
1850 Unknown 26.90
1851 Unknown 20.52
1852 Mix 4.14
1853 Unknown 3.90
1854 Unknown 4.02
1855 Unknown 4.42
1856 Unknown 4.99
1857 Unknown 22.96
1858 Unknown 23.45
1859 Poodle, Standard 4.39
1860 Unknown 19.82
1861 Mix 18.18
1862 Unknown 18.64
1863 Mix 17.75
1864 Unknown 23.90
1865 Mix 14.55
1866 Mix 18.40
1867 Terrier, Boston 19.33
1868 Shepherd 21.76
1869 Mix 25.92
1870 Terrier, American Pit Bull 15.43
1871 Unknown 17.13
1872 Mix 20.83
1873 Unknown 21.38
1874 Mix 9.56
1875 Retriever, Golden 36.15
1876 Bichon Frise 23.52
1877 German Shepherd 19.68
1878 Dachshund, Standard Smooth Haired 12.96
1879 Unknown 18.64
1880 Unknown 12.88
1881 Unknown 17.53
1882 Unknown 19.71
1883 Unknown 23.86
1884 Unknown 22.10
1885 Unknown 21.79
1886 Italian Greyhound 20.92
1887 Chihuahua, Short Coat 15.80
1888 Retriever, Labrador 20.33
1889 Mix 20.72
1890 Poodle, Miniature 25.10
1891 Unknown 20.60
1892 Maltese 18.70
1893 Unknown 28.76
1894 Mix 17.09
1895 Unknown 23.54
1896 Unknown 22.27
1897 Unknown 20.72
1898 Unknown 24.95
1899 Unknown 23.93
1900 Mix 32.63
1901 Terrier, Soft Coated Wheaten 20.07
1902 Unknown 21.49
1903 Chihuahua, Short Coat 14.92
1904 Poodle, Standard 20.05
1905 Unknown 17.52
1906 Unknown 18.12
1907 Unknown 18.36
1908 Boxer 21.45
1909 Mix 11.81
1910 Mix 12.71
1911 Unknown 19.05
1912 Siberian Husky 19.30
1913 Poodle, Standard 19.05
1914 Unknown 31.22
1915 Collie, Rough 26.46
1916 Mix 13.92
1917 Mix 20.48
1918 Unknown 27.19
1919 Australian Shepherd 28.38
1920 Retriever, Golden 11.49
1921 Mix 4.24
1922 Unknown 4.38
1923 Unknown 4.41
1924 Domestic Shorthair 3.66
1925 Unknown 4.53
1926 Unknown 4.23
1927 Unknown 4.20
1928 Unknown 4.70
1929 Unknown 4.82
1930 Unknown 4.71
1931 Unknown 4.38
1932 Mix 4.09
1933 Unknown 4.82
1934 Mix 4.21
1935 Unknown 4.99
1936 Mix 4.00
1937 Mix 4.29
1938 Unknown 4.49
1939 Mix 4.38
1940 Mix 4.75
1941 Mix 4.18
1942 Unknown 4.37
1943 Unknown 4.20
1944 Unknown 4.72
1945 Unknown 4.34
1946 Unknown 4.33
1947 Mix 5.19
1948 Mix 4.53
1949 Mix 4.37
1950 Unknown 4.28
1951 Unknown 4.45
1952 Unknown 4.62
1953 Mix 4.57
1954 Unknown 4.76
1955 Unknown 15.98
1956 Mix 22.62
Question 7
Create a new variable in the data, which contains the weights of all the animals, but rounded to the nearest kg.
Hints: Try looking up the help documentation for the function round(). Try playing with it in the console, e.g. round(c(3.5, 4.257, 1.1111)). You may find it helpful to look back at 1B #adding/changing-a-variable.
We’re probably going to want this variable as a column of the data, so don’t forget the dataframe$newvariable <- ...... bit.
Question 8
Try giving the dataset to the function summary(). You’ll get out some information on each of the variables. It is likely that you’ll get more useful information for the variables containing information on the animal’s weights than for those containing their names, breeds etc because these variables are vectors of “characters”. We’ll start to look more about different types of data next week.
Easy to do!
  license_year  license_number     animals_name         species
 Min.   :2015   Length:1956        Length:1956        Length:1956
 1st Qu.:2017   Class :character   Class :character   Class :character
 Median :2018   Mode  :character   Mode  :character   Mode  :character
 Mean   :2018
 3rd Qu.:2018
 Max.   :2018
 primary_breed      secondary_breed      weight_kg       weight_rounded
 Length:1956        Length:1956        Min.   :  0.390   Min.   :  0.0
 Class :character   Class :character   1st Qu.:  4.707   1st Qu.:  5.0
 Mode  :character   Mode  :character   Median : 16.630   Median : 17.0
                                       Mean   : 15.312   Mean   : 15.3
                                       3rd Qu.: 22.500   3rd Qu.: 22.0
                                       Max.   :103.480   Max.   :103.0
Simulating Dice
Question 9
Copy the code from the lecture which creates a custom function called dice() (copied below). Be sure to run the code (highlight it all with your cursor, and hit “run” in the top right, or press Ctrl/Cmd+Enter).
What did that code do?
In a sense, this code does nothing: It won’t give you any output when you run it. What it is actually doing, though, is defining a function called dice(). If you look at your environment panel (top right), you’ll see dice appear when you run the code.
To produce some output, we have to call the function dice() (by writing it into code: dice(4), for example). dice() wants to be supplied with some information (in the argument num). If no information is supplied, num will take a default value of 1. (So writing dice() is equivalent to writing dice(1)).
What does dice() do with num? It calls another function, sample(), with 3 arguments. We didn’t write sample(): it’s a function that’s “supplied with” R. To find out more about what sample() does:
click inside the brackets just after
sample()in your R script;press
TAB(⇥), thenF1you should see some help appear in the bottom right-hand panel of RStudio.
You will find that “sample() takes a sample … from the elements of x …” If you compare the code in RStudio to the code under “Usage” you’ll see that where the help has x, we have 1:6. So what does 1:6 mean? One way to find out is to open the console in RStudio (bottom left) and just type stuff in. What happens when you type 1:6? What about 2:17? (What about 6:1?)
Remember: The console is the place to “try stuff out” (don’t worry, you can’t break it).
What you will discover is that 1:6 creates a vector (list of similar things, in this case numbers) of the numbers 1-6. The next bit of the sample() function is size. In the dice() function, the num passes down to the size of the sample(): Looking through the help, size is the number of items to choose. So sample(1:6, 1) would choose one number from the numbers 1-6 at random; sample(1:6, 3) would choose 3, and so on. The last argument, replace=TRUE, tells sample() what to do with a number once it’s been picked: Does it go ‘back into the bag’ to be picked again (TRUE) or not? (FALSE)?
Around the outside is sum() which simply sums the numbers on however many (num) dice you “rolled”.
Putting it all together, our dice() function “throws num dice” by sample()ing from the numbers 1-6 num times, replaceing each number when it’s been picked, and sums the numbers of all the dice.
Question 10
Look up the function replicate(). We can use it to do something in R lots of times! For instance, replicate(20, 1+1) will evaluate 1+1 twenty times.
Use replicate() to simulate 20 rolls of a single dice, and store the results in an object in your environment. Give it an easily identifiable name.
Hints: A single dice means num = 1
Question 11
Create a barplot showing the frequency with which each number was landed on in the 20 rolls.
Hints: the functions table() and barplot() were used to do this in the lecture.
Your plots will look slightly different to these, because all of our dice are random!
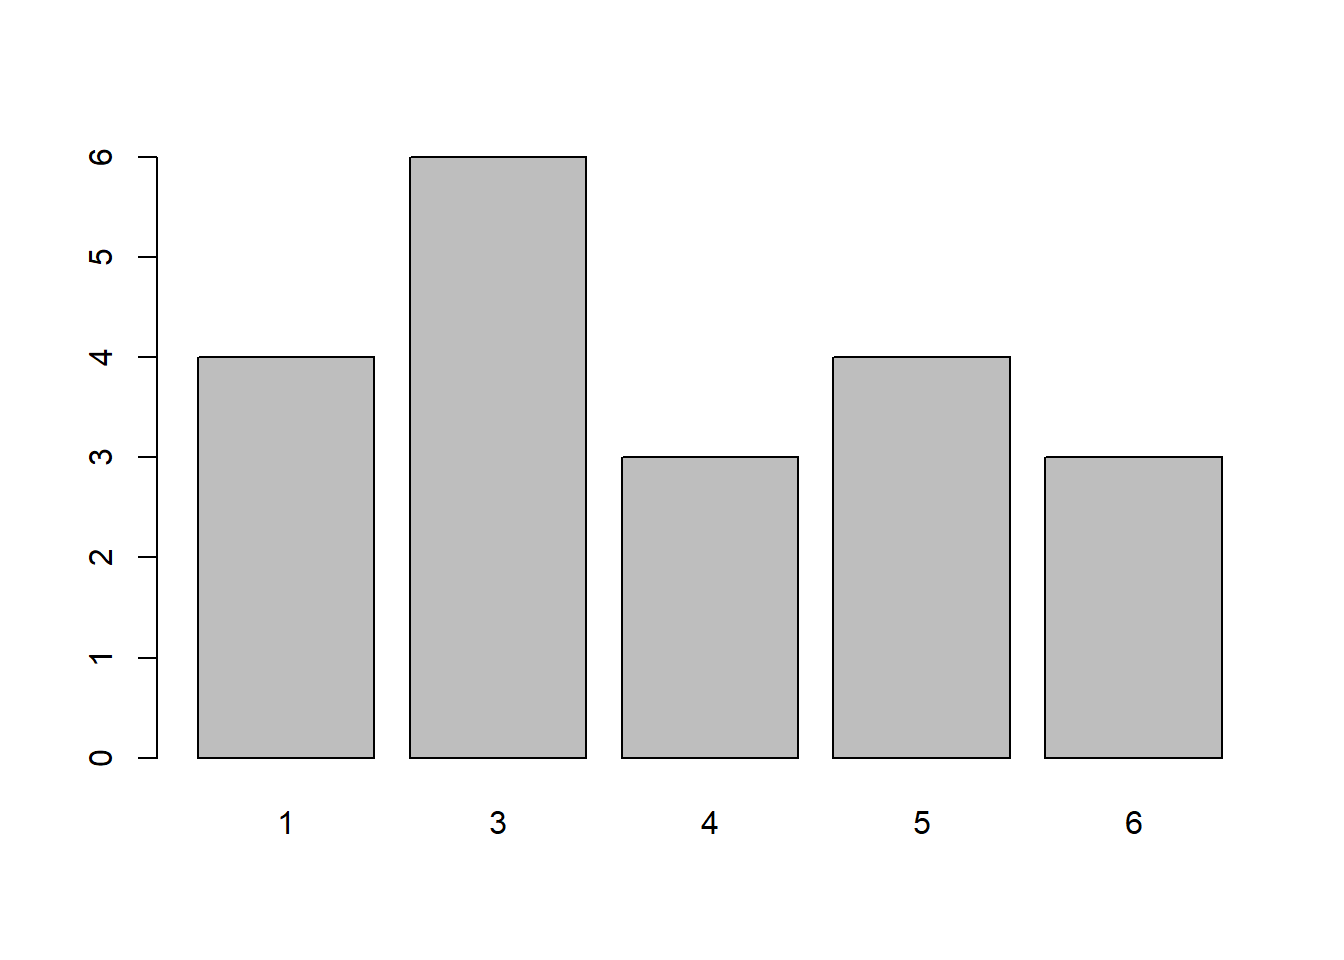
Question 12
Do the same for 1,000 rolls, and then for 10,000. What do you notice?
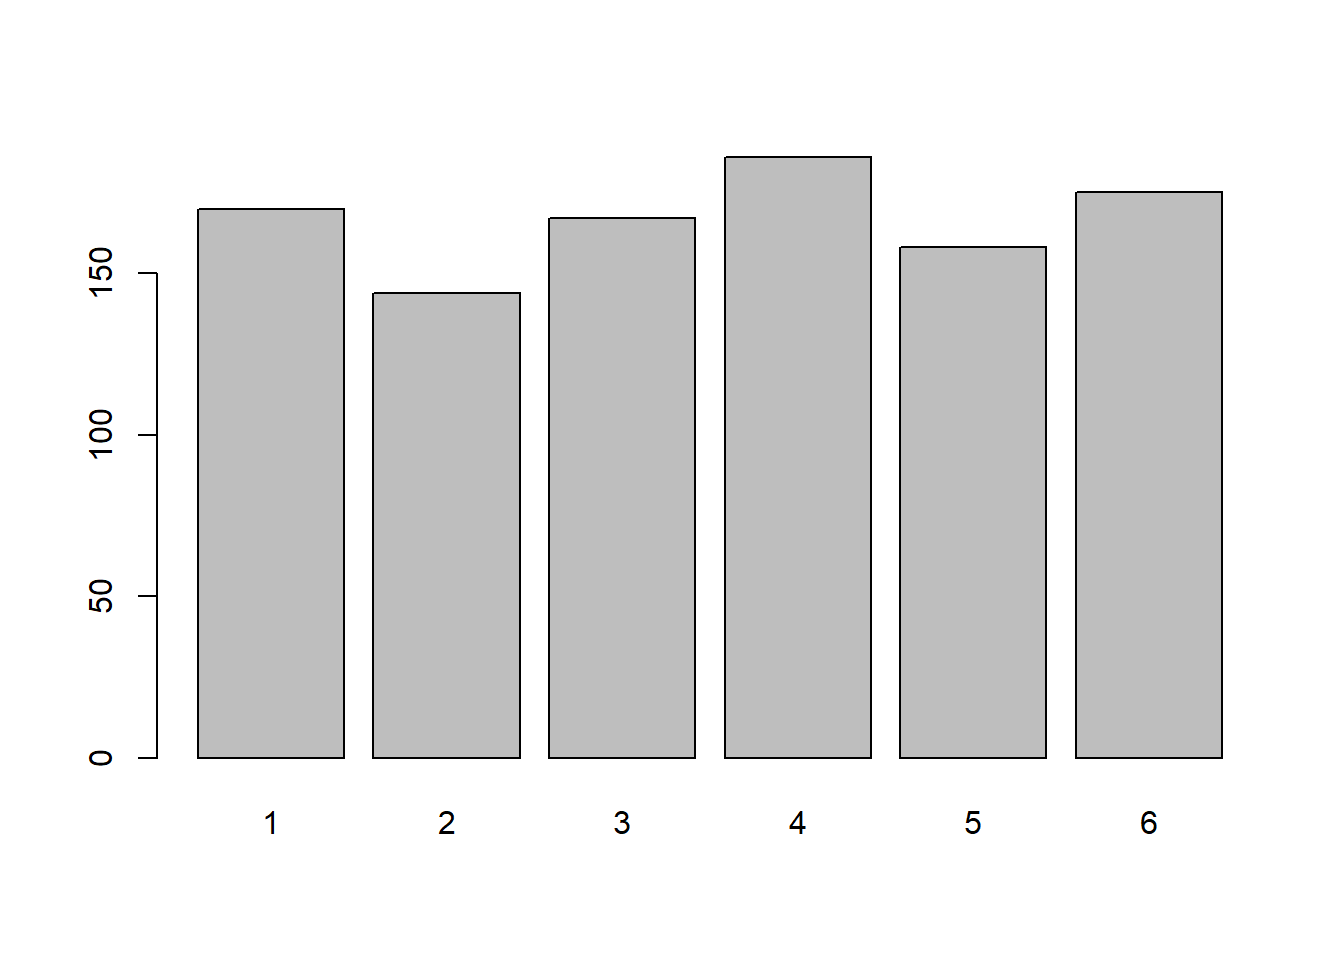
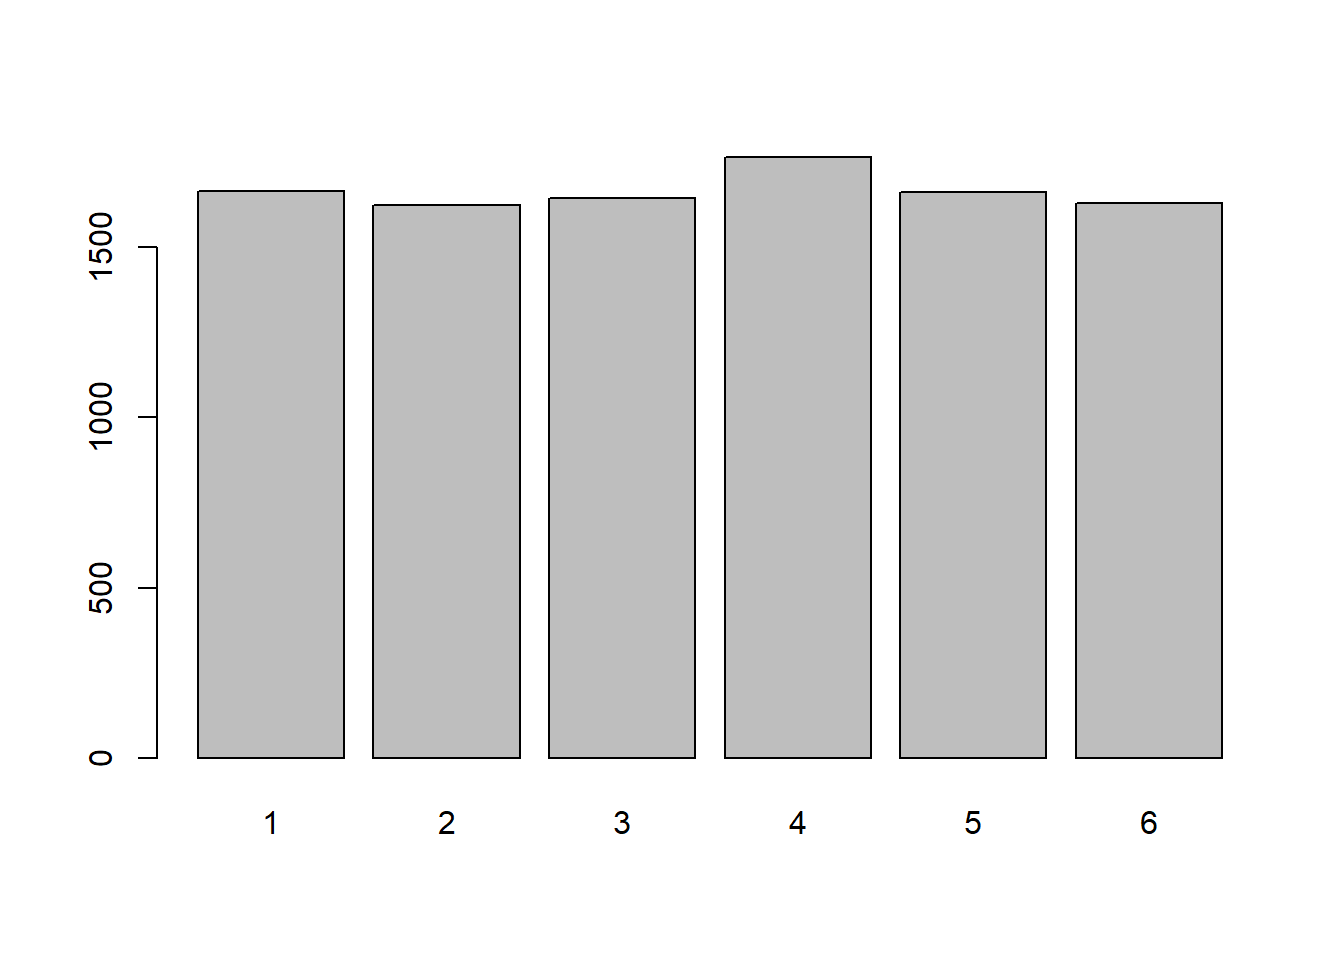
The more rolls we do of the dice, the flatter the graph becomes. This is because there is an equal probability of the die landing on any of the responses - there is a uniform probability.
Question 12
Copy the code below into your script and run it. It creates a new function called wdice() which simulates the rolling of num dice which are slightly weighted.
Roll a single weighted die 20 times and plot the frequency distribution. Do the same for 1,000 and 10,000 rolls of a single die. Does a pattern emerge? At how many rolls?
wdice <- function(num = 1){
    sum(sample(1:6, num, replace=TRUE, prob = c(0.15,0.15,0.15,0.15,0.15,0.25)))
}
wd <- replicate(20, wdice(1))
barplot(table(wd))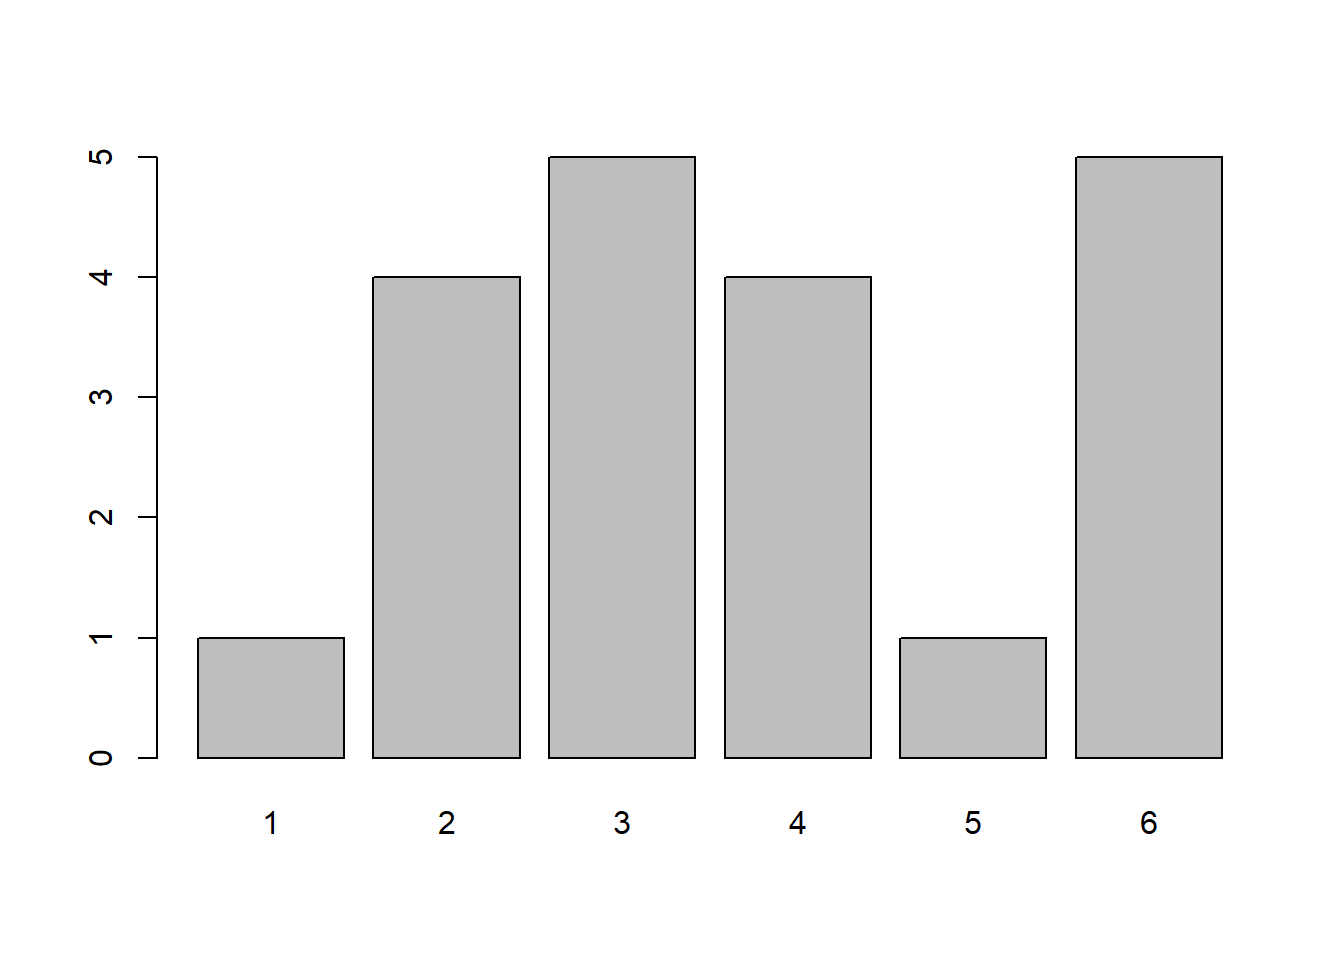
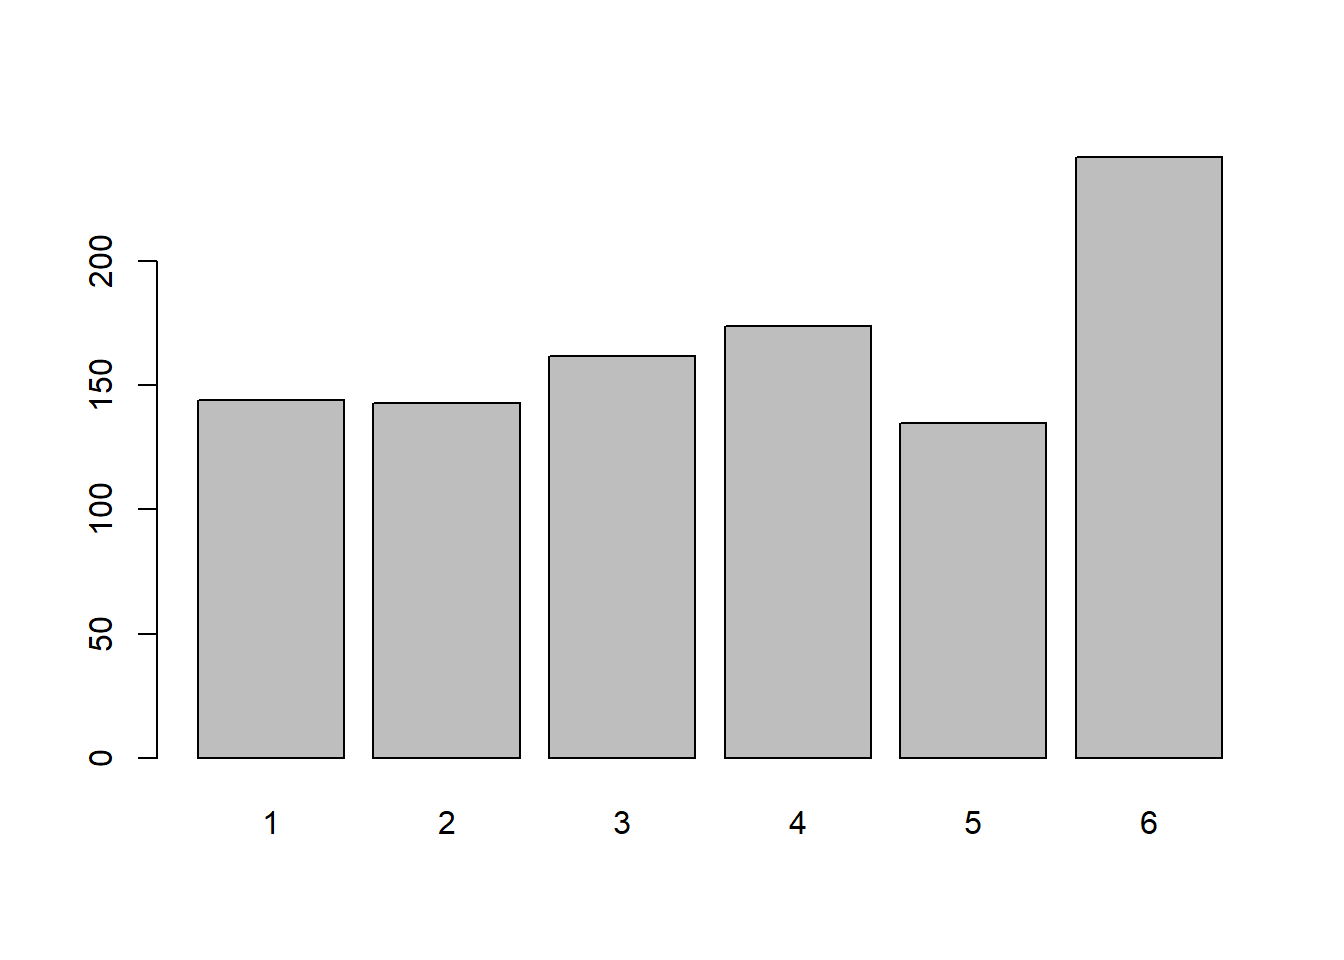
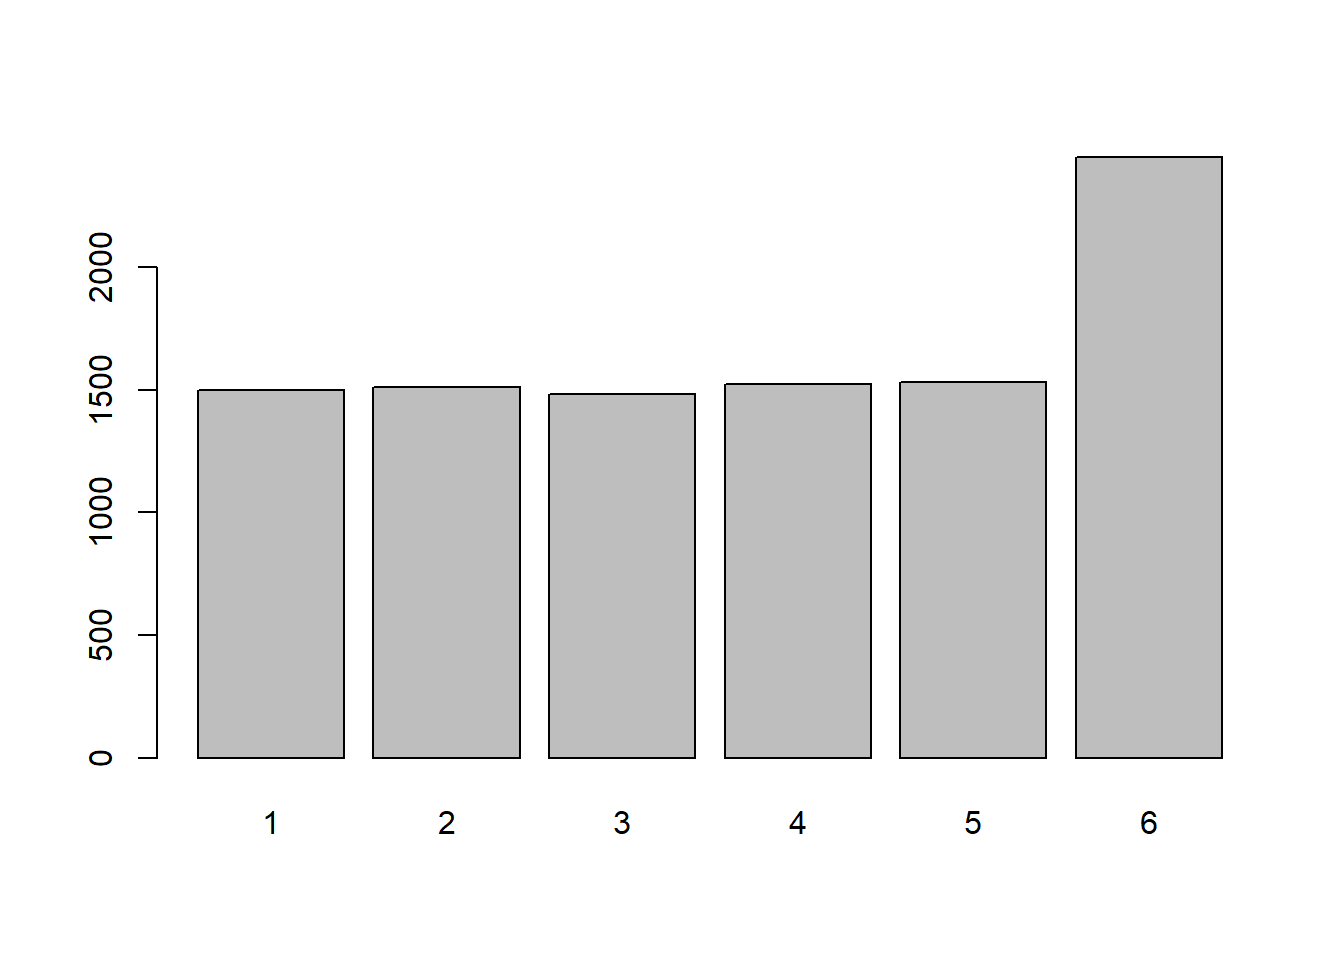
The die is clearly weighted towards landing on 6. However, is 20 rolls enough to reliably observe this? In our 20 rolls above, it landed on 2 quite a bit too! The pattern becomes clearer after 1000 rolls.
Question 14
Remember, wdice() and dice() are really just relying on different functions, like sample(). Try playing around with sample() in the console again - what does the prob = c(....) bit do?
The prob bit is defining the probabilities of observing each outcome - i.e. there is a 25% chance of rolling a 6.
Question 15
Let’s try to modify the wdice() function. Edit the code for wdice() so that 50% of the time it lands on number 6.
Hints:
- To test out your modified function, you will need to re-run the code which defines the function. When we use
wdice()we use the function which is in our environment. If we want to edit the function, we need to then overwrite (or “replace”/“reassign”) the object in our environment.
- We need to be careful to remember that the probability of different outcomes should sum to 1 (i.e., it’s not possible to “50% of the time land on 6” as well as “70% of the time land on 5”!).
Question 16
Can you observe the weighting in your new die (the one which 50% of the time lands on number 6) in only 20 rolls?
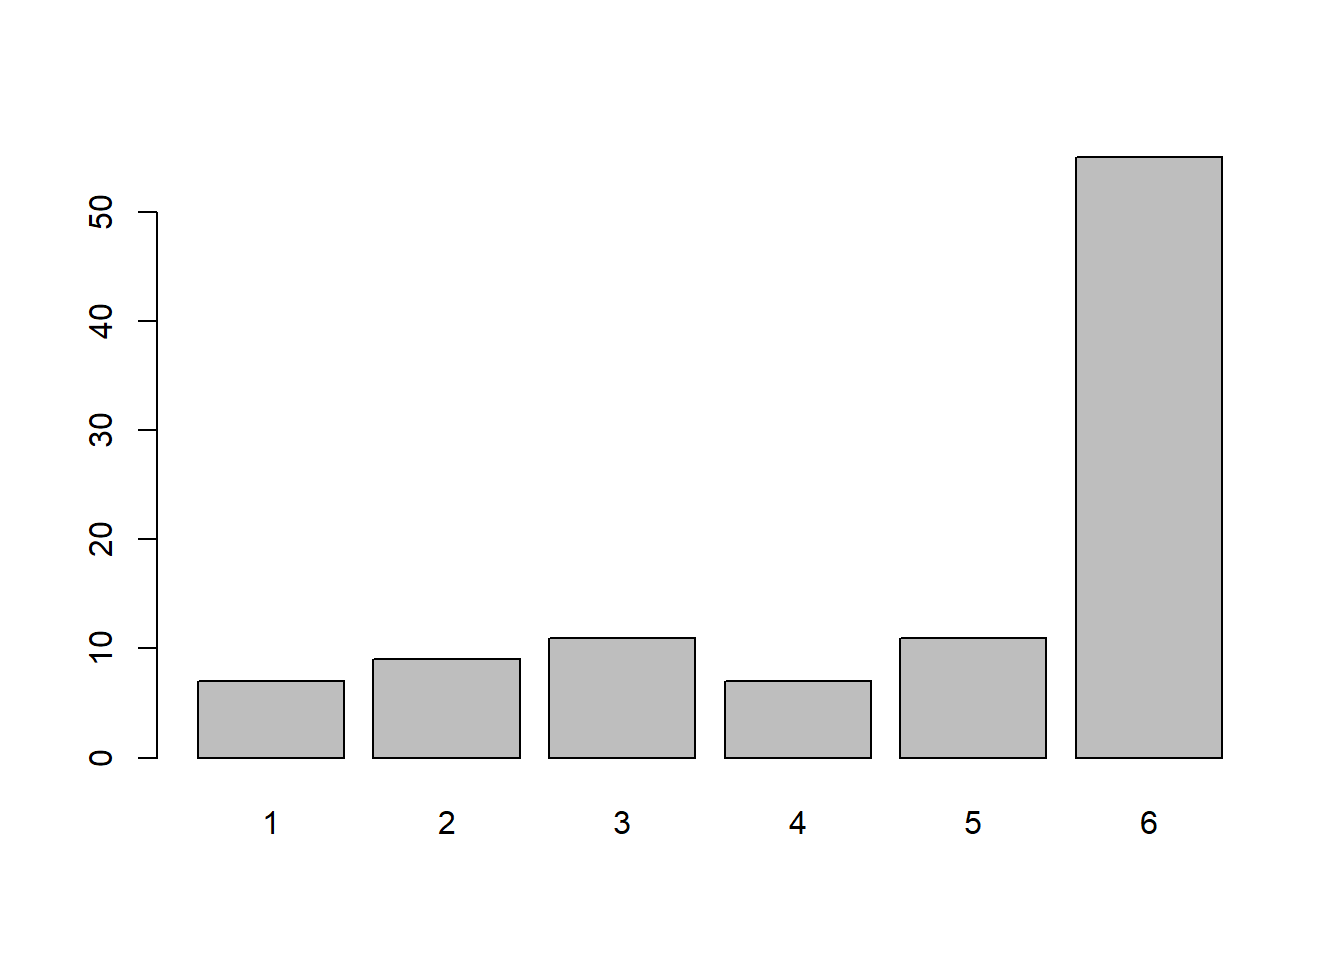
Question 17
Conceptually, what can we learn from this toy example?
The bigger the effect, the smaller the sample required to observe it!