couchto5k <- read_csv("https://uoepsy.github.io/data/couchto5k.csv")Week 11 Exercises: Tying up Loose Ends
Please Note
This might look like a lot of stuff, but it is just writing, bit by bit, the stuff that we have covered through the course.
When writing up – most important is to think carefully about what the questions are really asking (and therefore what kind of test might be appropriate), and to explain your analytical process as clearly as you can, pulling out and interpreting the key information from the models that help to guide the reader to your conclusion.
NOTE This is not a “perfect” answer (I may well have made mistakes, or have written certain sections unclearly).
Couch to 5k
Background: Couch to 5k
Couch to 5k is an NHS-sponsored fitness programme which lasts 9 weeks, taking participants from a gentle start up to a half-hour run.
The NHS wants to research some of the potential impact this programme has on wellbeing. They have conducted a small study of 121 people in 2 cities (Edinburgh and Glasgow), all of whom started the Couch to 5k programme, across the course of a year.
The researchers’ interests are two-fold: They are interested in the effects of taking the programme on psychological wellbeing, and also in the psychological factors that make people continue on the programme.
Methods
At Week 0, all participants completed a questionnaire measuring the psychometric factors of accountability and self-motivation.
Upon either completing the programme (Week 9) or dropping out (< Week 9), participants completed a questionnaire which included a measure of their self-reported happiness, and a “health” measure derived from a number of physiological tests. Researchers also recorded the season in which participants started the programme, as evidence from previous research suggests that the probability of completing the couch to 5k programme varies substantially across the year.
You can download the dataset from https://uoepsy.github.io/data/couchto5k.csv. Details of the variables can be found in the table below.
Please note that Couch to 5k is a real programme, but the data you will be analysing comes from our febrile minds.
Data Dictionary:
| Column | Content |
|---|---|
pptID |
random ID code for participant |
age |
age in years |
accountability |
psychometric measure of accountability (or ‘responsibility’) (Sum of 5 questions, each scored 1-7). |
selfmot |
psychometric measure of self-motivation (Sum of 5 questions, each scored 1-7) |
health |
multi-test health measure (0-100) |
happiness |
simple happiness scale (0-100) |
season |
season of the year participants were interviewed in |
city |
city participant was recruited in |
week_stopped |
week of programme participant stopped in (week 9 = completed the programme) |
Clean and describe
Question 1
Have a look at the data. Check for impossible values and deal with these in an appropriate manner. Describe the data, either in words or using suitable graphs (or a combination).
Write it up! Remember to detail the decisions you have made.
Hints
- to clean data, go through each variable in turn. If numeric, what is the min and max? If categorical, what are the possible levels?
- to describe data, you might want to use tables and plots, or you might find describing in text can work too.
- There’s no right way to deal with missing values.
- one option is to cross-tabulate the reasons for missingness, and then remove them from the dataset at this point. This means all your analyses are conducted on the same set of “complete cases”. This can be the neat and tidy option, but if some variables have lots of missingness, you might end up needlessly limiting some of your analyses in terms of statistical power.
- another option is to leave all missing values in the dataset and let them be dealt with by each of your model(s) and test(s). The downside of this is that different tests end up being performed on different subsets of data, making it harder to describe (it also means you need to be very careful with model comparisons)
- There’s no right way to deal with outliers.
- Some fields of research will identify at the outset any observations that are outlying by looking at each variable individually. These they will then remove, or scale back (6A #outliers) prior to any analysis. This should really only be done if you are sure that these observations are outlying because of either a) measurement error or b) not belonging to the target population of interest. If the outlyingness could well simply be natural variation in the variable, keep it in. You can always then examine its influence on subsequent analyses!

City differences
Question 2
The researchers conducting the study want to first find out a little more about differences between the Edinburgh and Glasgow study sites. Specifically, they would like to investigate whether dropping out of the programme early (prior to week 5), late (week 5 onwards) or not at all (completed all 9 weeks), is different between Edinburgh and Glasgow participants. They would also like to know if the average age of participants is different between the cities.
Perform any appropriate analyses and write up your methods and results, providing plots and tables where useful.
Hints
- There are two questions here: city differences in dropout, and city differences in age. These are nice and simple questions about the relationships between only two variables.
- You might need to make a new variable for “early/late/no dropout”.
- The first 5 weeks of the course focused on some of the more fundamental tests of relationships between two variables. Some of these might be useful here!

Happiness, Health, and a 5k Run
Question 3
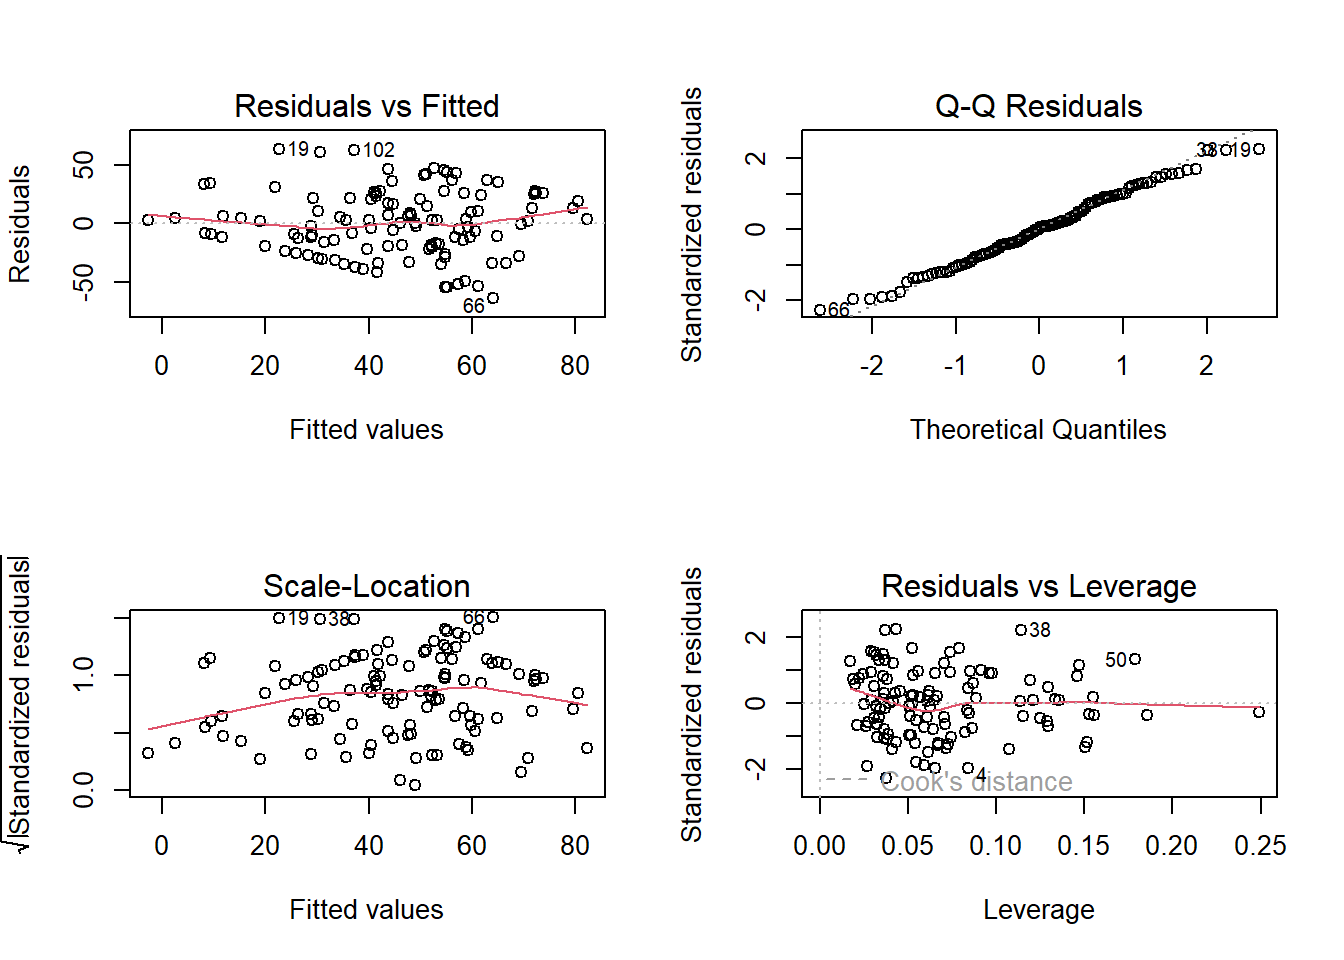
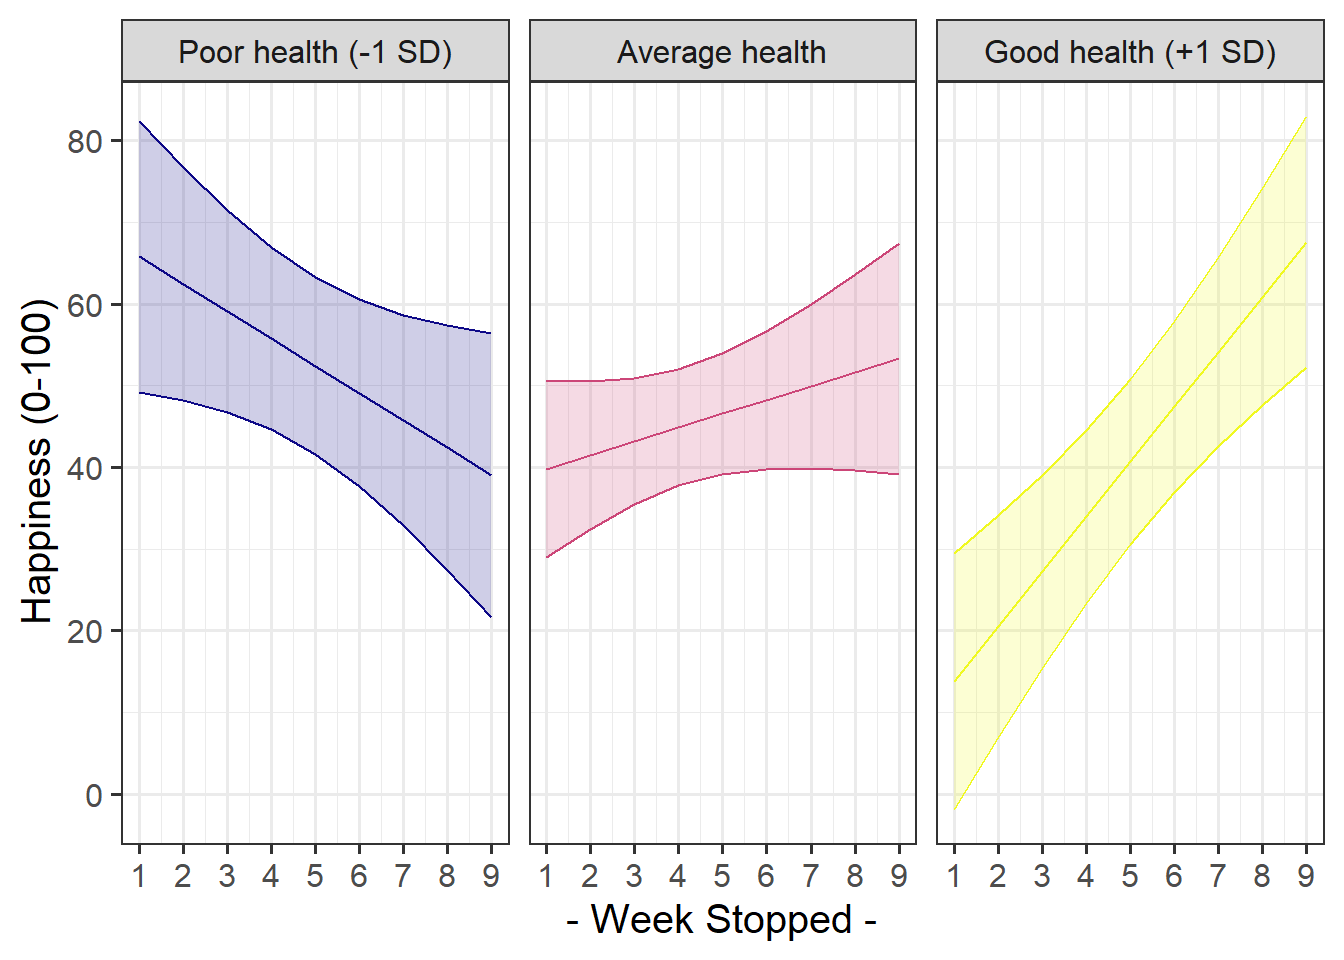
Researchers would like you to examine whether, beyond seasonal and age-related variation, happiness ratings are influenced by how far participants get through the couchto5k programme. Note that they are interested specifically in whether - and how - the effects of couchto5k progression are amplified by feeling healthy, such that getting further along in the programme might lead to greater increases in happiness when people are healthier.
Perform an appropriate analysis and write up your methods and results, providing plots and tables where useful.
Hints
- The use of the word “beyond” here should cue us to be thinking in terms of multiple regression. The question is asking about the relationship between happiness and couchto5k progression after we account for participants’ ages and the season in which they took the programme.
- We also have a clear suggestion of an interaction here, because it asks about an effect of one predictor on the outcome (programme progression on happiness) being “amplified” (i.e. different) by another predictor (health)
- This feels a bit like two questions, but the latter really supersedes the first - if we have an interaction, then the question of “what is the effect of progression on happiness?” can only really be answered with “it depends..”.

Predictors of Drop-out
Question 4
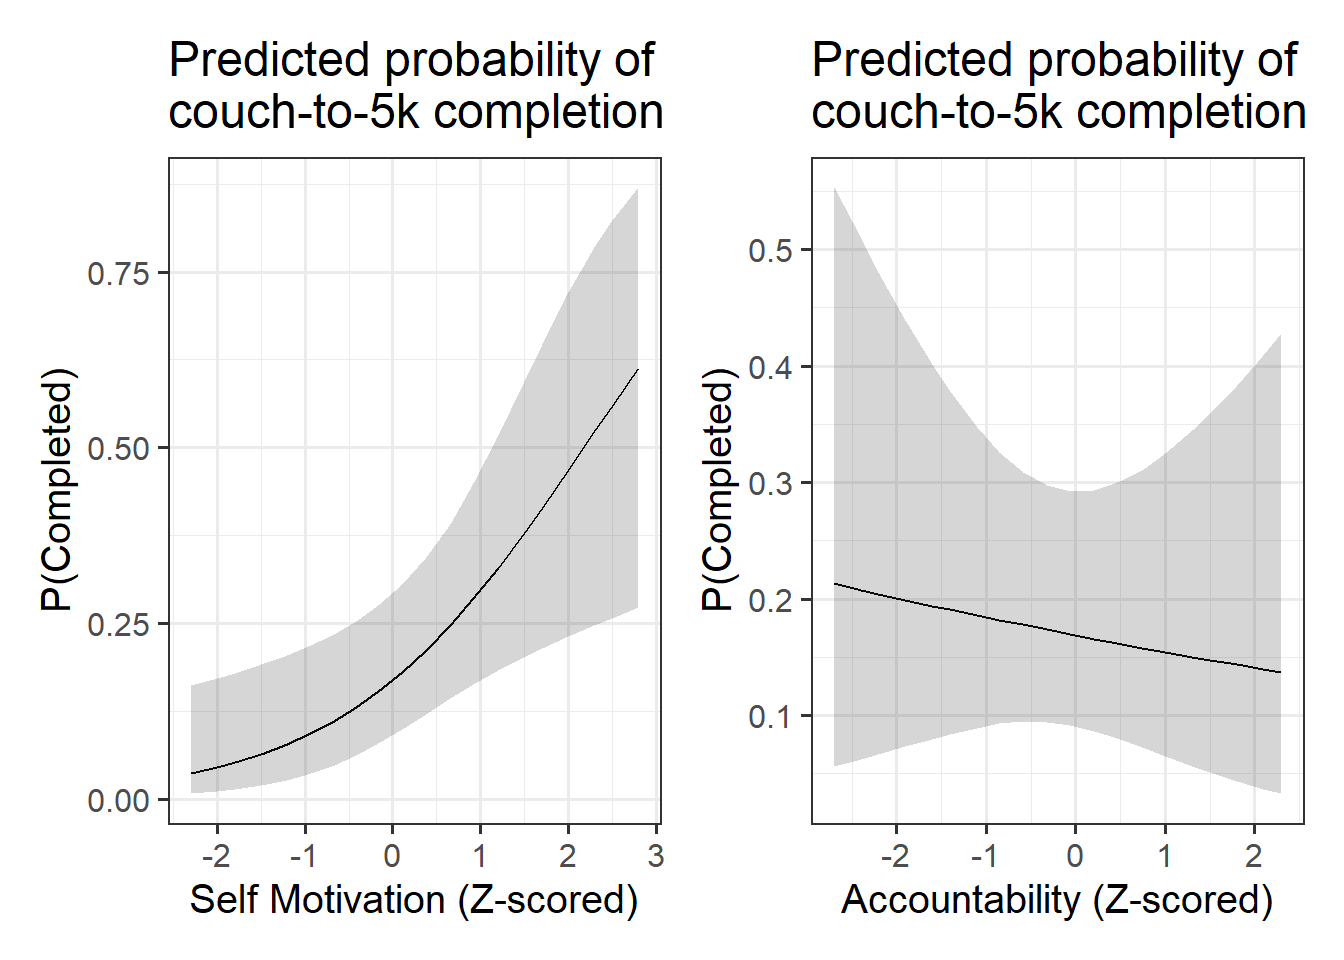
The second aim of the research is to examine the psychological factors that are associated with people completing the programme.
Perform an appropriate analysis and write up your methods and results, providing plots and tables where useful.
Hints
- Completing vs Dropping-out? Sounds like a binary outcome!
- Recall (from study description above) that completing the programme has previously been found to vary substantially across the year. We may well therefore want to account for this in our model!
- What variables do we have that measure “psychological factors” that might influence dropping out? (pay attention to when each variable is measured!)
- How might we visualise the results?

Footnotes
If we had reason to believe the variances are not equal, we can look at doing Welch’s t-test↩︎