| Variable | Description |
|---|---|
| license_year | Year in which license was issued |
| license_number | Unique license ID number |
| animals_name | Full name of pet |
| species | Species of pet |
| primary_breed | Primary breed of pet |
| secondary_breed | Secondary breed of pet |
| weight_kg | Weight in kilograms |
Exercises: Intro R
First things
The very first things to do are to open RStudio and get a blank script ready for writing your code!
Our recommendation is that you have an R project for this course, and use a new script for each week of work. See the tip about “R projects” in Section 1A.
Pet Data
We’re going to play with some data on a sample of licensed pets from the city of Seattle, USA. It can be downloaded (or read directly into R) from https://uoepsy.github.io/data/pets_seattle.csv. It contains information on the license ID, year of issue, as well as the species, breeds and weights of each pet. You can find a data dictionary in Table 1
Question 1
Write a line of code that reads in the data to your R session. Then examine the dimensions of the dataset, and take a look at the first few lines.
Hints
You’ll need the read.csv() function. Remember to assign it a name to store it in your environment.
1B #basic-data-wrangling contains an example of reading in data from a URL. You’ll then want to play with functions like dim() and head().
Question 2
What are the names of the 47th and the 200th animals in the dataset? (use R code to find out)
Hints
You’ll probably want to make use of the square brackets data[rows, columns].
Question 3
Subset the data to only the animals which are dogs, and store this subset as another named object in your environment.
Do the same for the cats.
Hints
You’ll want to think about how we access data via asking for those entries that meet a specific condition (see 1B #accessing-by-a-condition)
Question 4
Find the name and weight of the heaviest cat, and of the lightest dog.
Hints
You could do this using the original data you read in from question 1, or use the subsets you created in question 3. You’ll again want to supply a condition within square brackets data[?==?]. That condition may well have something to do with being equal to the min() or the max() of some variable.
Question 5
Does the original dataset contain only dogs and cats?
Hints
Given what you did in question 3, you might be able to answer this by just looking at your environment.
Question 6
Extract the entries of the original dataset for which the species is neither “Dog” nor “Cat”?
What are the names and species of these animals?
Hints
This is a slightly complex one. 1B #more-complex-conditions might help you here.
Question 7
Create a new variable in the data, which contains the weights of all the animals, but rounded to the nearest kg.
Hints
Try looking up the help documentation for the function round(). Try playing with it in the console, e.g. round(c(3.5, 4.257, 1.1111)). You may find it helpful to look back at 1B #adding/changing-a-variable.
- “to the nearest kg” would mean we want no decimal points. Note that
round()has a digits argument. e.g.round(22.324, digits = 2)andround(22.324, digits = 1)do different things.
Question 8
Try giving the dataset to the function summary(). You’ll get out some information on each of the variables. It is likely that you’ll get more useful information for the variables containing information on the animal’s weights than for those containing their names, breeds etc because these variables are vectors of “characters”. We’ll start to look more about different types of data next week.
Simulating Dice
Question 9
Copy the code from the lecture which creates a custom function called dice() (copied below).
Be sure to run the code (highlight it all with your cursor, and hit “run” in the top right, or press Ctrl/Cmd+Enter).
dice <- function(num = 1) {
  sum(sample(1:6, num, replace=TRUE))
}
What did that code do?
In a sense, this code does nothing: It won’t give you any output when you run it. What it is actually doing, though, is defining a function called dice(). If you look at your environment panel (top right), you’ll see dice appear when you run the code.
To produce some output, we have to call the function dice() (by writing it into code: dice(4), for example). dice() wants to be supplied with some information (in the argument num). If no information is supplied, num will take a default value of 1. (So writing dice() is equivalent to writing dice(1)).
What does dice() do with num? It calls another function, sample(), with 3 arguments. We didn’t write sample(): it’s a function that’s “supplied with” R. To find out more about what sample() does:
click inside the brackets just after
sample()in your R script;press
TAB(⇥), thenF1you should see some help appear in the bottom right-hand panel of RStudio.
You will find that “sample() takes a sample … from the elements of x …” If you compare the code in RStudio to the code under “Usage” you’ll see that where the help has x, we have 1:6. So what does 1:6 mean? One way to find out is to open the console in RStudio (bottom left) and just type stuff in. What happens when you type 1:6? What about 2:17? (What about 6:1?)
Remember: The console is the place to “try stuff out” (don’t worry, you can’t break it).
What you will discover is that 1:6 creates a vector (list of similar things, in this case numbers) of the numbers 1-6. The next bit of the sample() function is size. In the dice() function, the num passes down to the size of the sample(): Looking through the help, size is the number of items to choose. So sample(1:6, 1) would choose one number from the numbers 1-6 at random; sample(1:6, 3) would choose 3, and so on. The last argument, replace=TRUE, tells sample() what to do with a number once it’s been picked: Does it go ‘back into the bag’ to be picked again (TRUE) or not? (FALSE)?
Around the outside is sum() which simply sums the numbers on however many (num) dice you “rolled”.
Putting it all together, our dice() function “throws num dice” by sample()ing from the numbers 1-6 num times, replaceing each number when it’s been picked, and sums the numbers of all the dice.
Question 10
Use the function you just made to ‘roll a die’ a few times. Check that it works like you expect.
Hints
You just need to run dice() a few times. A single die means num = 1, which is the default.
Question 11
Look up the function replicate(). We can use it to do something in R lots of times! For instance, replicate(20, 1+1) will evaluate 1+1 twenty times.
Use replicate() to simulate 20 rolls of a single die, and store the results in an object in your environment. Give it an easily identifiable name.
What does each value in this object represent?
Question 12
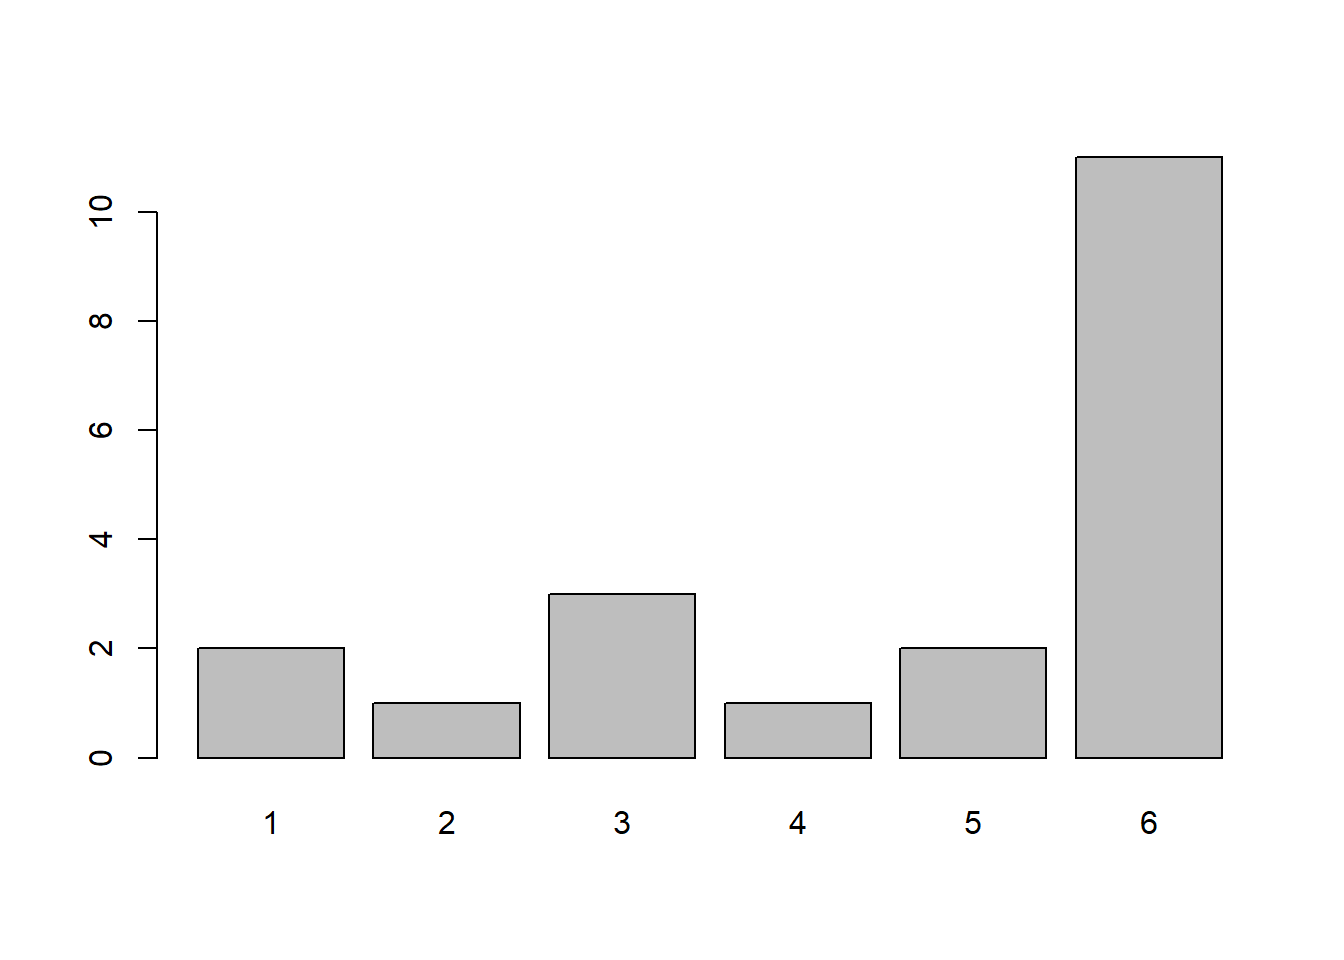
Create a barplot showing the frequency with which each number was landed on in the 20 rolls.
Hints
The functions table() and barplot() were used to do this in the lecture.

Question 13
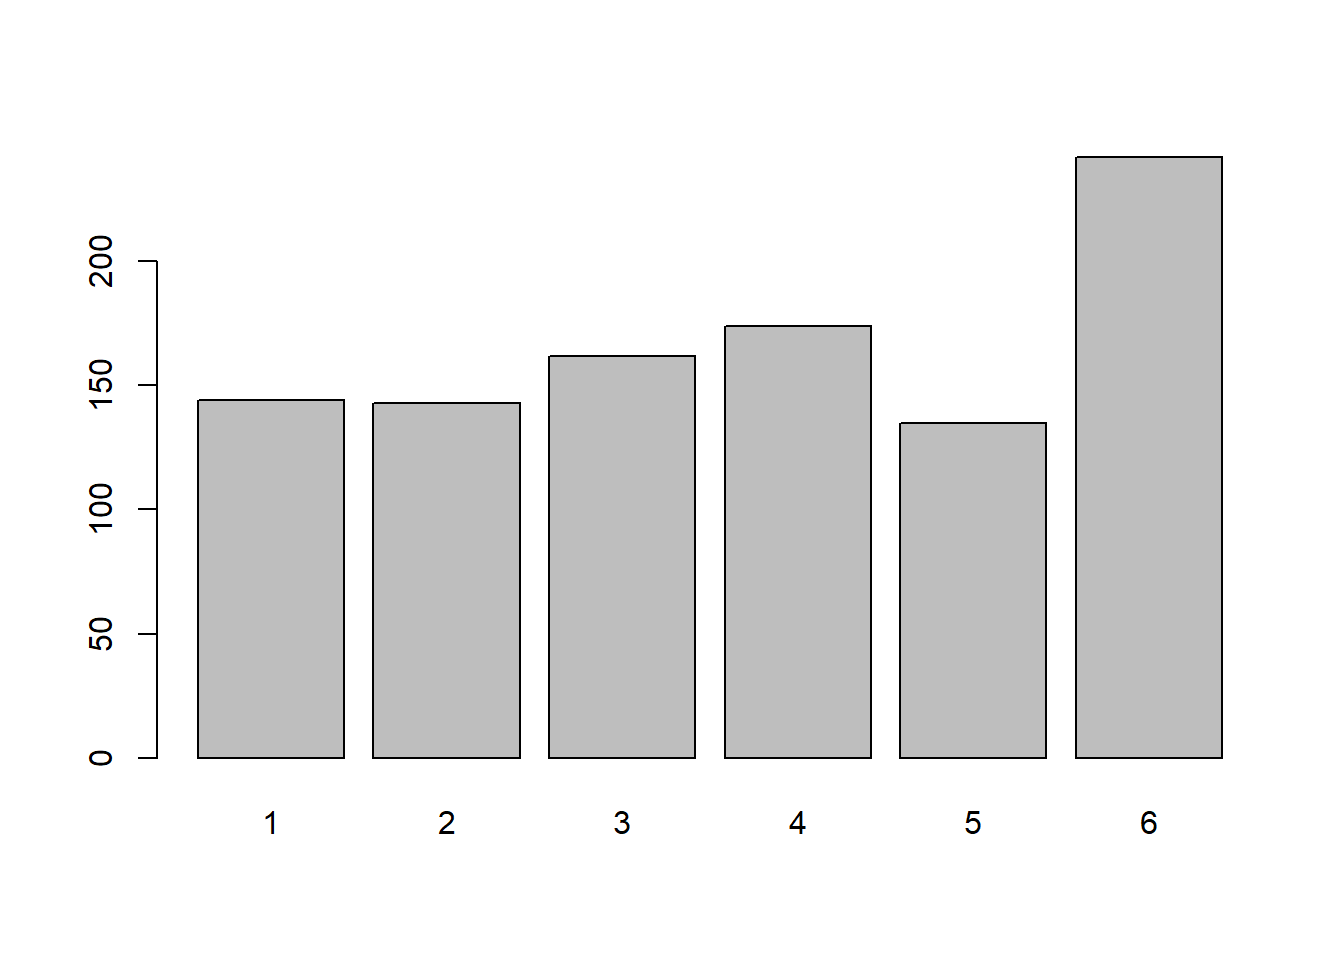
Do the same for 100 rolls, and then for 1,000. What do you notice?


Question 14
Copy the code below into your script and run it. It creates a new function called wdice() which simulates the rolling of num dice which are slightly weighted.
Roll a single weighted die 20 times and plot the frequency distribution. Do the same for 100 and 1,000 rolls of a single die. Does a pattern emerge? At how many rolls?
wdice <- function(num = 1){
    sum(sample(1:6, num, replace=TRUE, prob = c(0.15,0.15,0.15,0.15,0.15,0.25)))
}


Question 15
Remember, wdice() and dice() are really just relying on different functions, like sample(). Try playing around with sample() in the console again - what does the prob = c(....) bit do?
Question 16
Let’s try to modify the wdice() function. Edit the code for wdice() so that 50% of the time it lands on number 6.
Hints
- To test out your modified function, you will need to re-run the code which defines the function. When we use
wdice()we use the function which is in our environment. If we want to edit the function, we need to then overwrite (or “replace”/“reassign”) the object in our environment.
- We need to be careful to remember that the probability of different outcomes should sum to 1 (i.e., it’s not possible to “50% of the time land on 6” as well as “70% of the time land on 5”!).
Question 17
Can you observe the weighting in your new die (the one which 50% of the time lands on number 6) in only 20 rolls?
Question 18
Conceptually, what can we learn from this toy example?