This is optional for the DAPR3 course, but may be useful for your dissertations should your field/supervisor prefer the ANOVA framework to that of the linear model.
This walks briefly through these models with the ez package. There are many other packages available, and many good tutorials online should you desire extra resources in the future:
- https://www.datanovia.com/en/lessons/repeated-measures-anova-in-r
- https://www.r-bloggers.com/2021/04/repeated-measures-of-anova-in-r-complete-tutorial/
- https://stats.idre.ucla.edu/r/seminars/repeated-measures-analysis-with-r/
- https://www.datanovia.com/en/lessons/mixed-anova-in-r/
Data
The data is from a simulated experiment in which heart rate variability (HRV) was measured for amateur basketball players when tasked with scoring a goal with varying levels and type of potential loss/reward.
The data was split over two files. The code below will read in both datasets and join them for you:
Code
library(tidyverse)
library(readxl)
download.file(url = "https://uoepsy.github.io/data/basketballhrv.xlsx",
              destfile = "baskeballhrvdata.xlsx")

bball <-
  left_join(
    read_csv("https://uoepsy.github.io/data/basketballconditions.csv"),
    read_xlsx("baskeballhrvdata.xlsx") %>%
      pivot_longer(trial_1:trial_20, names_to = "trial_no", values_to = "hrv")
  ) %>%
  mutate(sub = factor(sub))
One-Way Repeated Measures ANOVA
For a repeated measures ANOVA, our independent variables are within groups.
Following from the example study above, we might consider using it to answer the question below.
Question: What is the effect of the size of reward on stress levels (as measured by HRV)?
The easiest way to conduct a repeated measures ANOVA in R is to use the ez package.
It comes with some handy functions to visualise the experimental design.
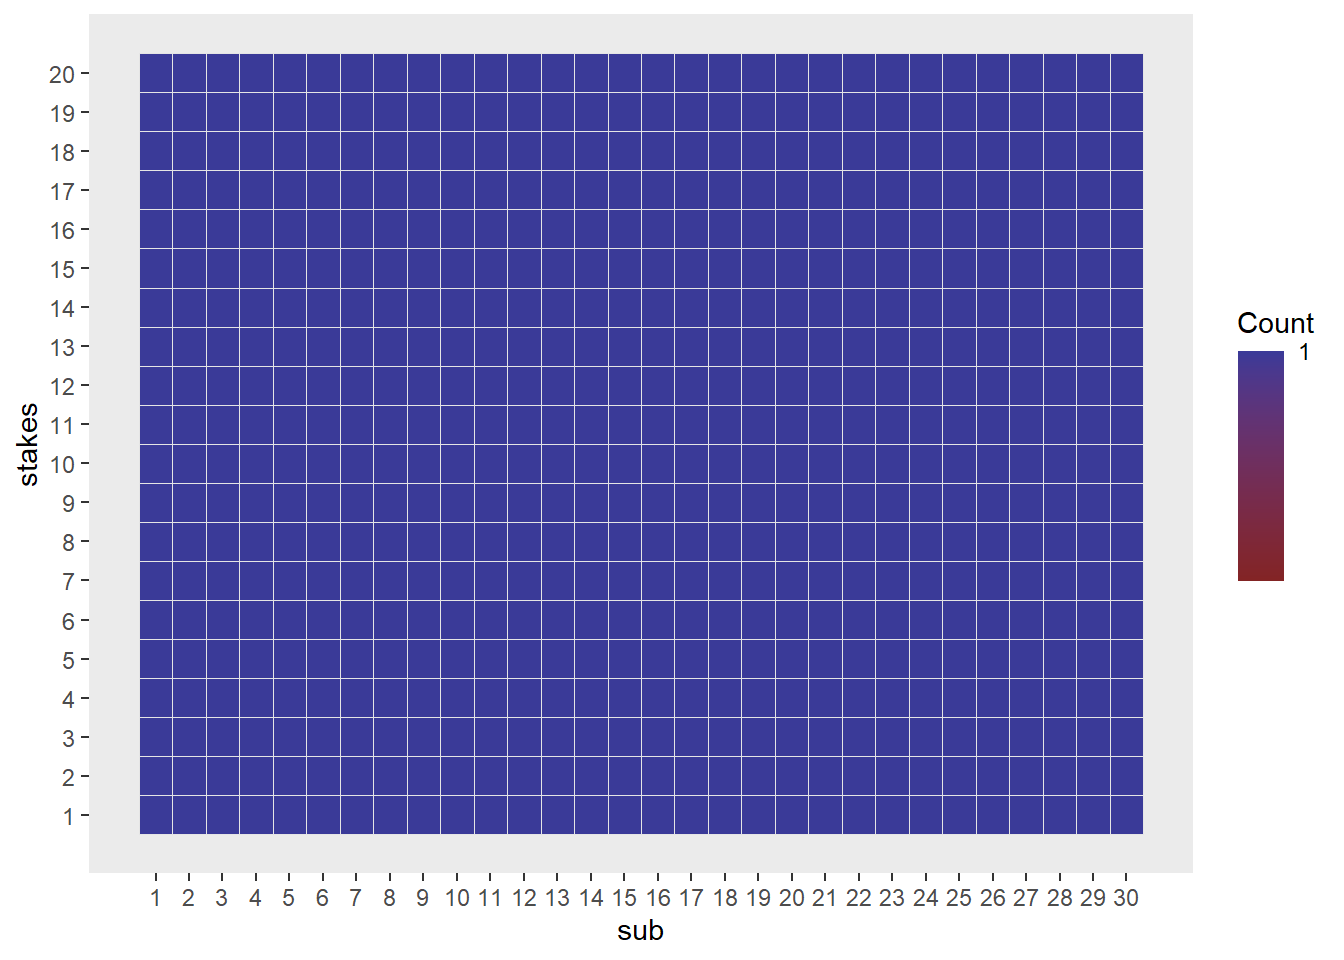
We can see from below that every participant completed a trial for each value of reward-size (1-20 points):
Code
library(ez)
ezDesign(data = bball, x = sub, y = stakes)
The ezANOVA() function takes a few arguments.
The ones you will need for this are:
- data the name of the dataframe
- dv the column name for the dependent variable
- wid the column name for the participant id variable
- within the column name(s) for the predictor variable(s) that vary within participants
- between the column name(s) for any predictor variable(s) that vary between participants
Fit a repeated measures ANOVA to examine the effect of the size of reward on HRV.
Code
ezANOVA(data=bball, dv=hrv, wid = sub, within = stakes)
$ANOVA
  Effect DFn DFd        F         p p<.05        ges
1 stakes   1  29 1.254585 0.2718695       0.04146761
Mixed ANOVA
Mixed ANOVA can be used to investigate effects of independent variables that are at two different levels, i.e. some are within clusters and some are between.
Question: Does the influence of the size of reward/loss on stress levels differ depending upon whether it is money vs reputation at stake?
Look at the two lines below. Can you work out what the plots will look like before you run them?
Code
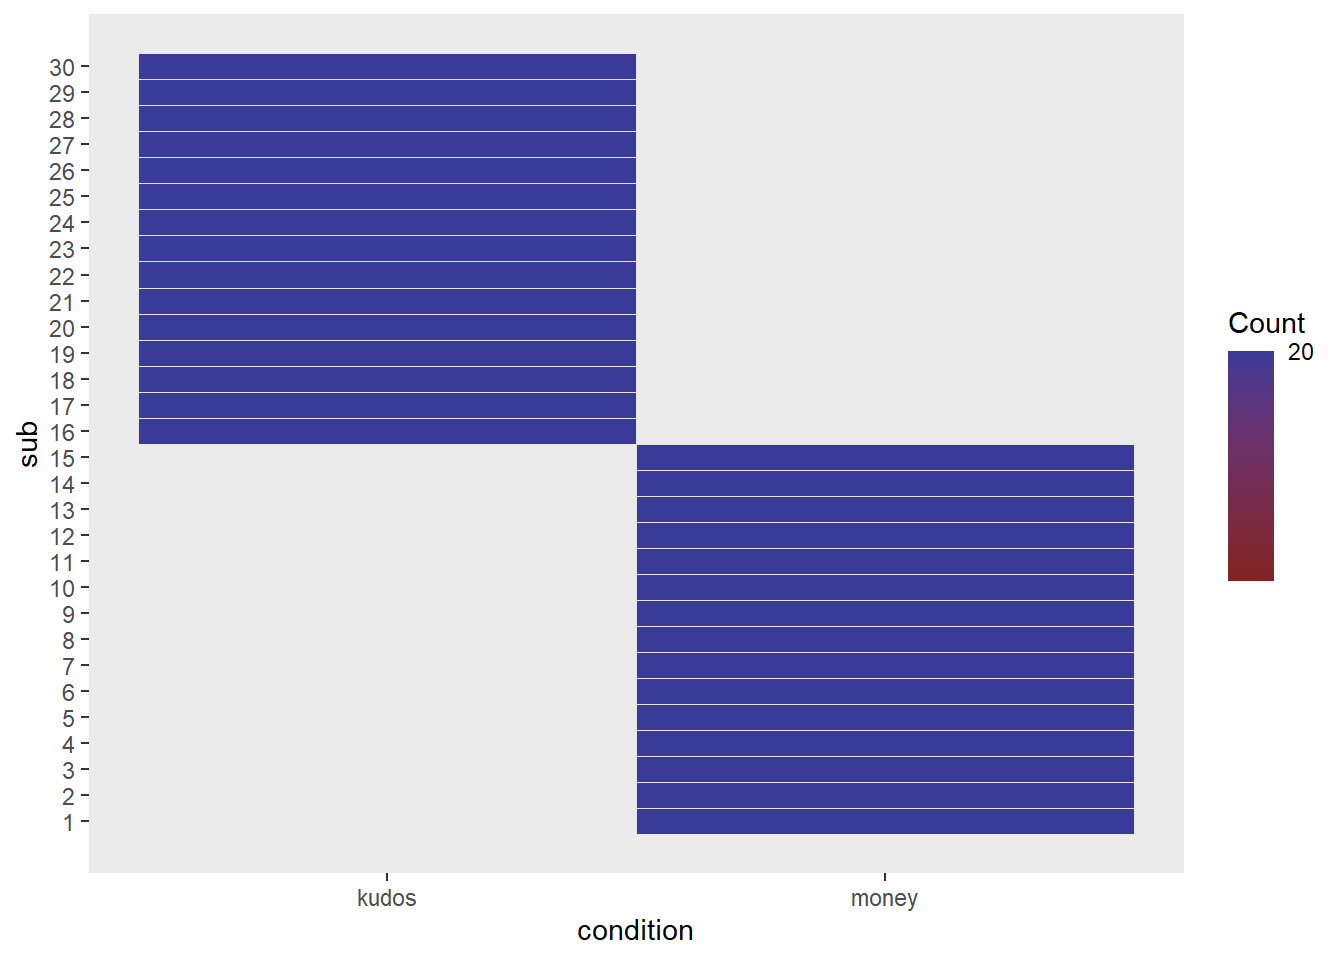
ezDesign(data = bball, x = condition, y = sub)
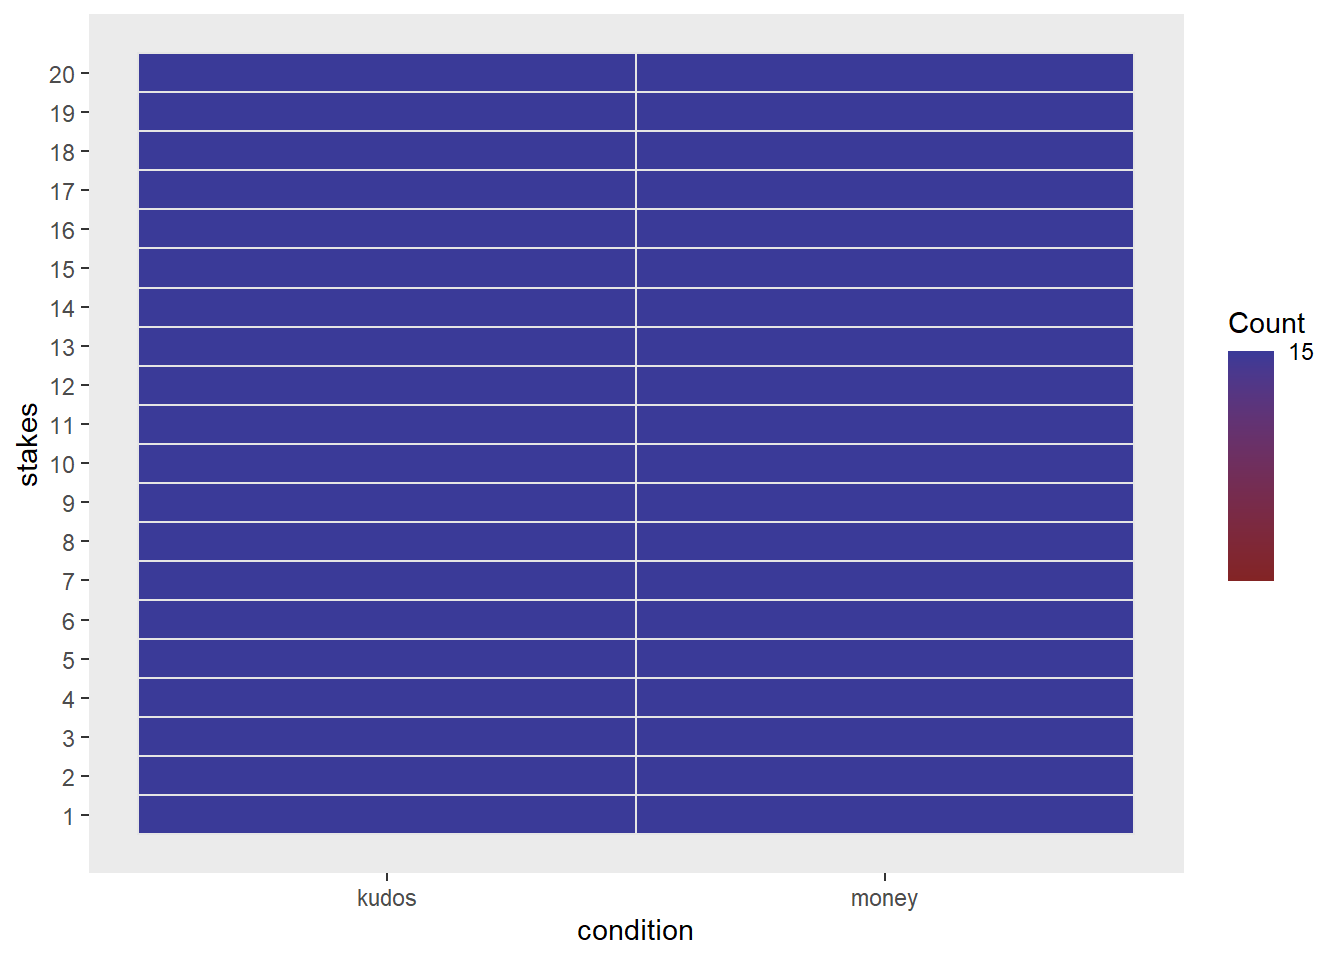
ezDesign(data = bball, x = condition, y = stakes)
Participants 1-15 are in one condition, and 16-30 are in another.
This should look like a two big blocks on the diagonal.
Code
ezDesign(data = bball, x = condition, y = sub)
In each condition, the full set of stakes (1-20 points) were observed in the same number of trials. This should be a full grid:
Code
ezDesign(data = bball, x = condition, y = stakes)
Fit a mixed ANOVA to examine the interaction between size and type of reward on HRV.
Code
ezANOVA(data=bball, dv=hrv, wid = sub, within = stakes, between = condition)
$ANOVA
            Effect DFn DFd        F          p p<.05        ges
1        condition   1  28 3.021712 0.09314393       0.06041768
2           stakes   1  28 1.260498 0.27109204       0.01786900
3 condition:stakes   1  28 1.136668 0.29546463       0.01614191
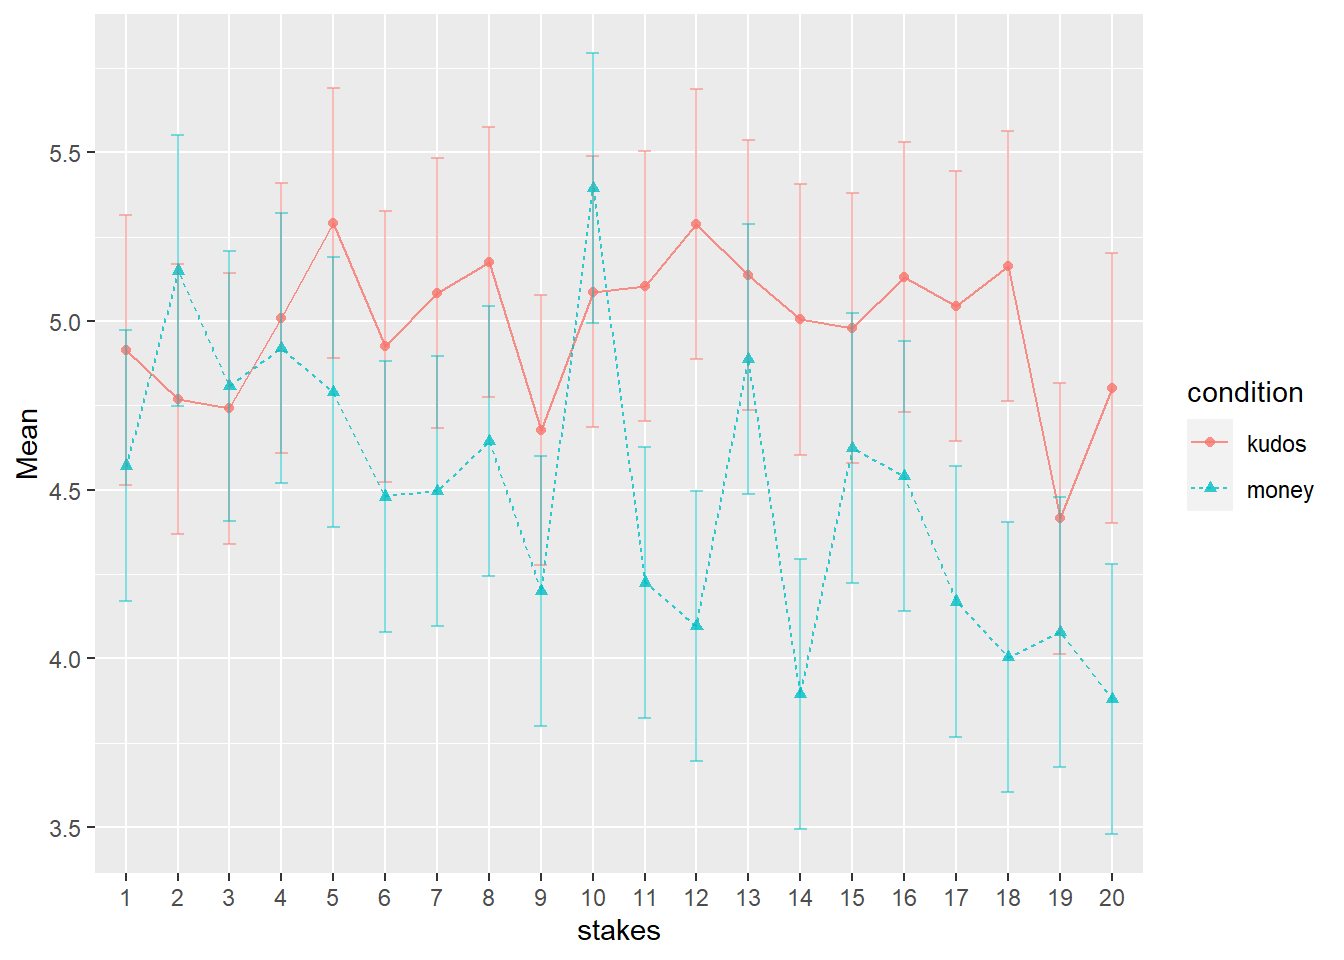
The ez package also contains some easy plotting functions for factorial experiments, such as ezPlot(). It takes similar arguments to the ezANOVA() function.
- look up the help documentation for
ezPlot().
- let’s use
ezPlot() to make a nice plot (Note: we may need to make sure that the stakes variable is a factor).
Code
bball <- bball %>% mutate(stakes = factor(stakes))
ezPlot(data=bball, dv=hrv, wid = sub, within = stakes, between = condition, x = stakes, split = condition)