| variable | description |
|---|---|
| age | Age in years of respondent |
| outdoor_time | Self report estimated number of hours per week spent outdoors |
| social_int | Self report estimated number of social interactions per week (both online and in-person) |
| routine | Binary 1=Yes/0=No response to the question 'Do you follow a daily routine throughout the week?' |
| wellbeing | Warwick-Edinburgh Mental Wellbeing Scale (WEMWBS), a self-report measure of mental health and well-being. The scale is scored by summing responses to each item, with items answered on a 1 to 5 Likert scale. The minimum scale score is 14 and the maximum is 70 |
| location | Location of primary residence (City, Suburb, Rural) |
| steps_k | Average weekly number of steps in thousands (as given by activity tracker if available) |
Multiple Linear Regression
Learning Objectives
At the end of this lab, you will:
- Extend the ideas of single linear regression to consider regression models with two or more predictors
- Understand and interpret the coefficients in multiple linear regression models
Requirements
- Be up to date with lectures
- Have completed Week 1 lab exercises
Required R Packages
Remember to load all packages within a code chunk at the start of your RMarkdown file using library(). If you do not have a package and need to install, do so within the console using install.packages(" "). For further guidance on installing/updating packages, see Section C here.
For this lab, you will need to load the following package(s):
- tidyverse
- psych
- patchwork
- sjPlot
- kableExtra
Presenting Results
All results should be presented following APA guidelines.If you need a reminder on how to hide code, format tables/plots, etc., make sure to review the rmd bootcamp.
The example write-up sections included as part of the solutions are not perfect - they instead should give you a good example of what information you should include and how to structure this. Note that you must not copy any of the write-ups included below for future reports - if you do, you will be committing plagiarism, and this type of academic misconduct is taken very seriously by the University. You can find out more here.
Lab Data
You can download the data required for this lab here or read it in via this link https://uoepsy.github.io/data/wellbeing_rural.csv
Study Overview
Research Question
Is there an association between wellbeing and time spent outdoors after taking into account the association between wellbeing and social interactions?
Setup
- Create a new RMarkdown file
- Load the required package(s)
- Read the wellbeing dataset into R, assigning it to an object named
mwdata
Exercises
Study & Analysis Plan Overview
Provide a brief overview of the study design and data, before detailing your analysis plan to address the research question.
- Give the reader some background on the context of the study (you might be able to re-use some of the content you wrote for Lab 1 here)
- State what type of analysis you will conduct in order to address the research question
- Specify the model to be fitted to address the research question
- Specify your chosen significance (\(\alpha\)) level
- State your hypotheses
Much of the information required can be found in the Study Overview codebook.
Descriptive Statistics & Visualisations
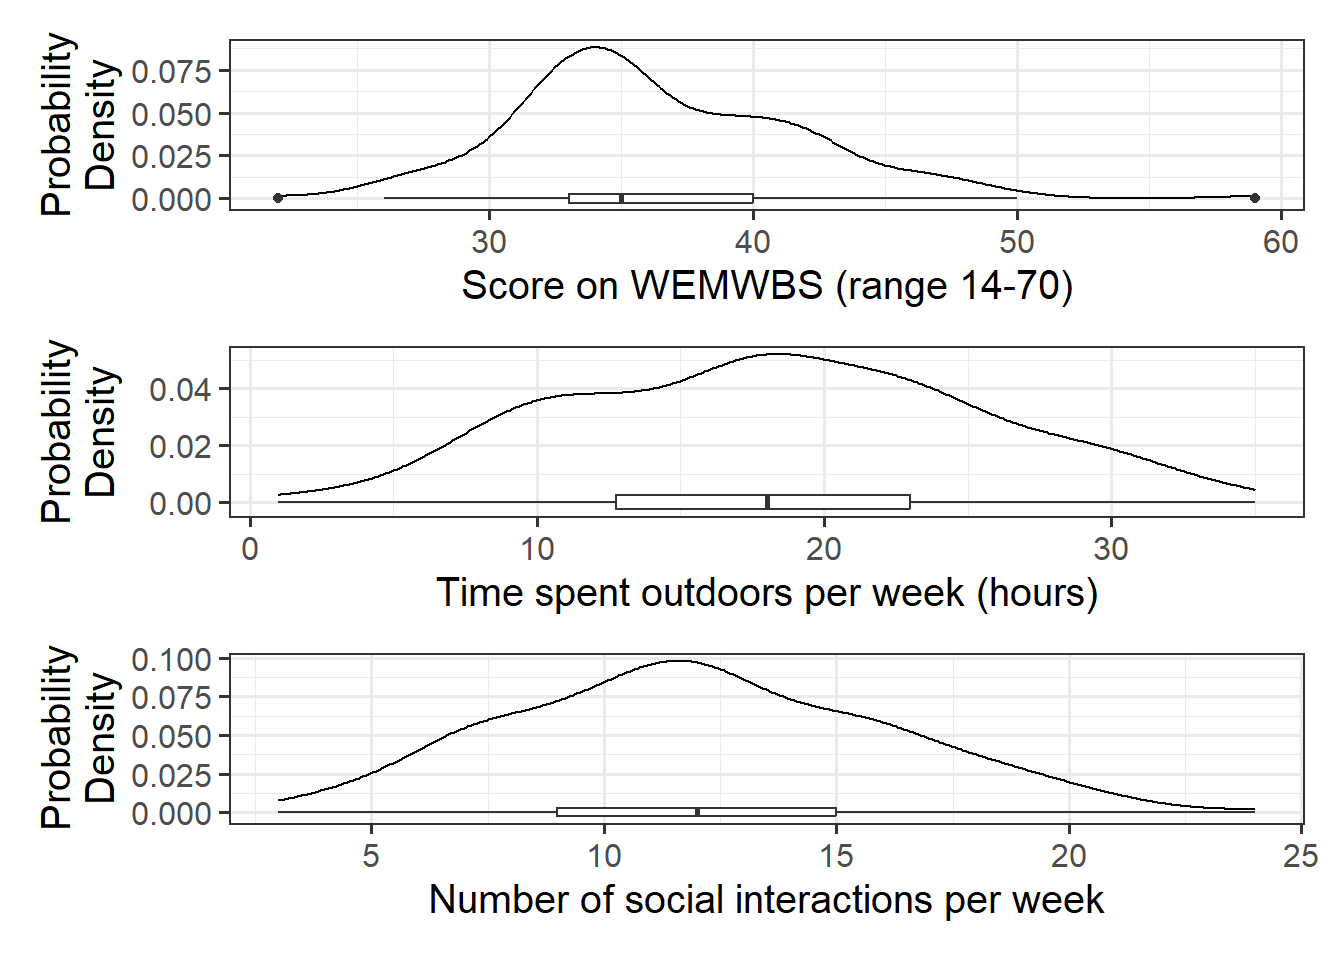
Alongside descriptive statistics, visualize the marginal distributions of the wellbeing, outdoor_time, and social_int variables.
Code for tables & plots - You might be able to re-use some of the code you wrote for Lab 1 here, and remember that you can refer back to the DAPR1 materials too
Plot interpretation
- The shape, center and spread of the distribution
- Whether the distribution is symmetric or skewed
- Whether the distribution is unimodal or bimodal
Plotting tips
- Use \n to wrap text in your titles and or axis labels
- The patchwork package allows us to arrange multiple plots in two ways - | arranges the plots adjacent to one another, and / arranges the plots on top of one another
Table tips
- The describe() function from the psych package will produce a table of descriptive statistics. If you would like only a subset of this output (e.g., mean, sd), you can use select() after calling describe() e.g., describe() %>% select(mean, sd)
- The kableExtra package allows us to produce well formatted tables for our descriptive statistics. To do so, you need to specify the kable() and kable_styling() arguments
- Review the guidance on the rmd bootcamp, particularly Lesson 4
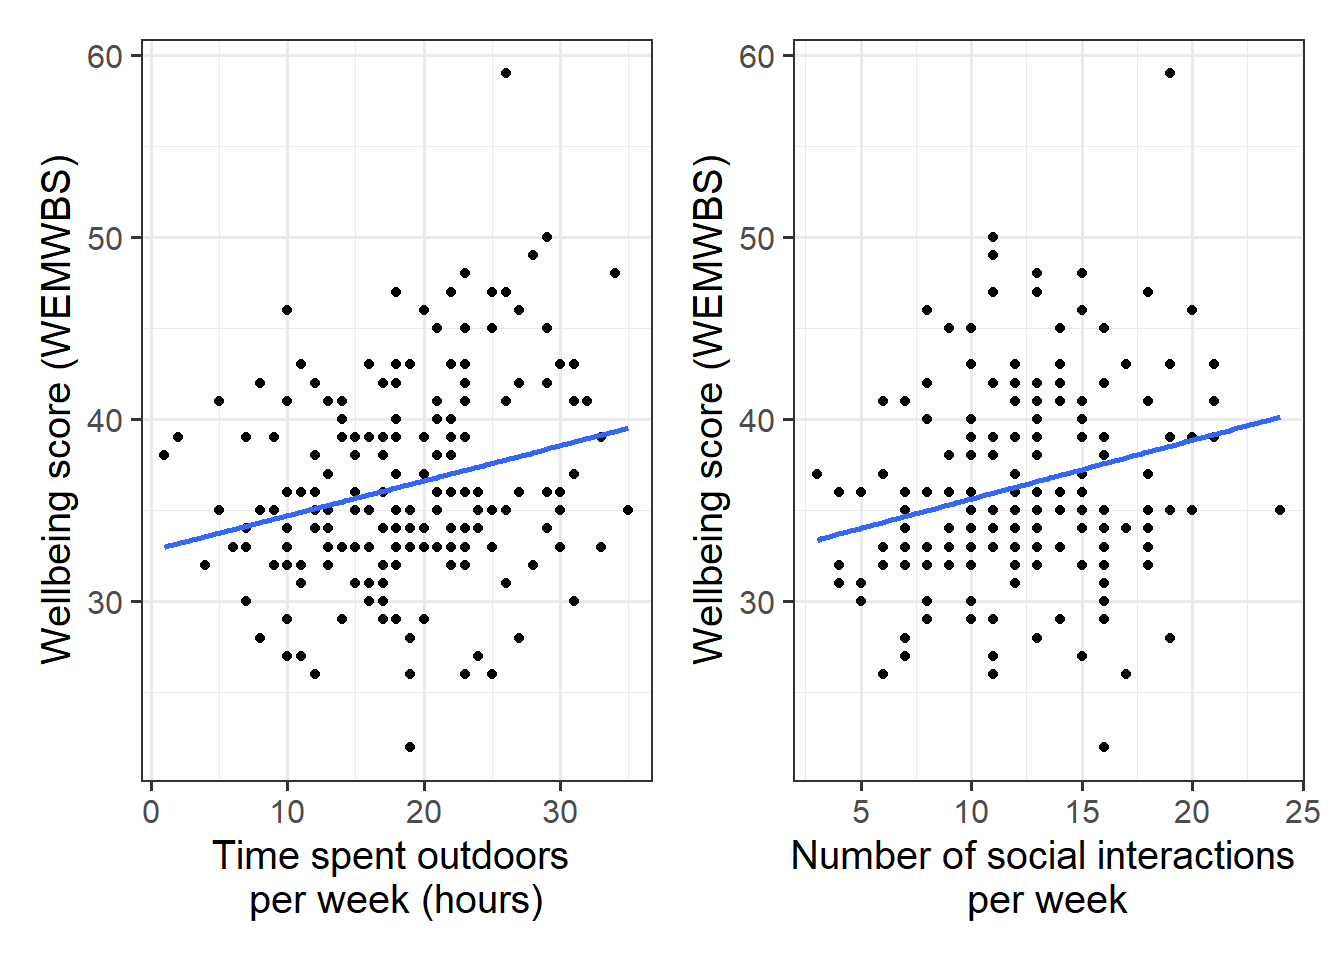
Produce plots of the associations between the outcome variable (wellbeing) and each of the explanatory variables.
Plot interpretation
- Direction of association
- Form of association (can it be summarised well with a straight line?)
- Strength of association (how closely do points fall to a recognizable pattern such as a line?)
- Unusual observations that do not fit the pattern of the rest of the observations and which are worth examining in more detail
Plot tips
- use \n to wrap text in your titles and or axis labels
- consider using geom_smooth() to superimpose the best-fitting line describing the association of interest
Produce a correlation matrix of the variables which are to be used in the analysis, and write a short paragraph describing the associations.
Model Fitting & Interpretation
Recall the model specified in Q1, and:
- State the parameters of the model. How do we denote parameter estimates?
- Fit the linear model in using
lm(), assigning the output to an object calledmdl1.
As we did for simple linear regression, we can fit our multiple regression model using the lm() function. We can add as many explanatory (i.e., independent) variables as we like, separating them with a +.
model name <- lm(dependent variable ~ independent variable 1 + independent variable 2 + …, data = dataframe)
Visual
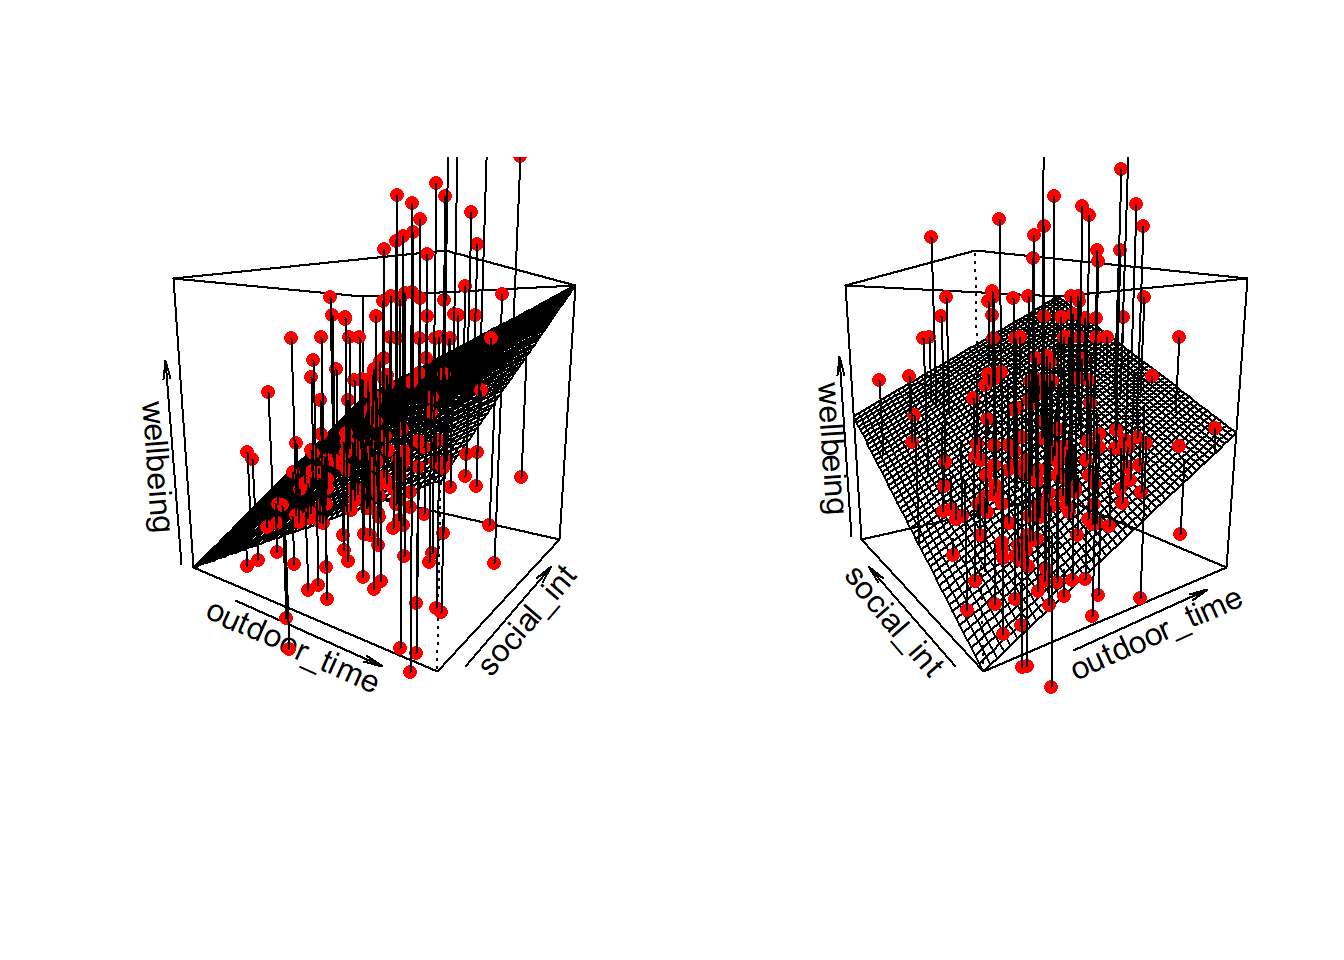
Note that for simple linear regression we talked about our model as a line in 2 dimensions: the systematic part \(\beta_0 + \beta_1 x\) defined a line for \(\mu_y\) across the possible values of \(x\), with \(\epsilon\) as the random deviations from that line. But in multiple regression we have more than two variables making up our model.
In this particular case of three variables (one outcome + two explanatory), we can think of our model as a regression surface (see Figure 3). The systematic part of our model defines the surface across a range of possible values of both \(x_1\) and \(x_2\). Deviations from the surface are determined by the random error component, \(\hat \epsilon\).

Don’t worry about trying to figure out how to visualise it if we had any more explanatory variables! We can only concieve of 3 spatial dimensions. One could imagine this surface changing over time, which would bring in a 4th dimension, but beyond that, it’s not worth trying!
Using any of:
mdl1mdl1$coefficientscoef(mdl1)coefficients(mdl1)summary(mdl1)
Write out the estimated parameter values of:
-
\(\hat \beta_0\), the estimated average wellbeing score associated with zero hours of outdoor time and zero social interactions per week.
-
\(\hat \beta_1\), the estimated increase in average wellbeing score associated with an additional social interaction per week (an increase of one), holding weekly outdoor time constant.
- \(\hat \beta_2\), the estimated increase in average wellbeing score associated with one hour increase in weekly outdoor time, holding the number of social interactions constant
When the remaining explanatory variables are held at the same value or are fixed.
Within what distance from the model predicted values (the regression line) would we expect 95% of WEMWBS wellbeing scores to be?
Based on the model, predict the wellbeing scores for the following individuals who were not included in the original sample:
- Leah: Social Interactions = 25; Outdoor Time = 3
- Sean: Social Interactions = 19; Outdoor Time = 36
- Mike: Social Interactions = 15; Outdoor Time = 20
- Donna: Social Interactions = 7; Outdoor Time = 1
Who has the highest predicted wellbeing score, and who has the lowest?
It might be helpful to review the ’Model predicted values for other (unobserved data) from the Predicted Values & Residuals of Lab 1.
Writing Up & Presenting Results
Provide key model results in a formatted table.
Use tab_model() from the sjPlot package.
You can rename your DV and IV labels by specifying dv.labels and pred.labels. To do so, specify your variable name on the left, and what you would like this to be named in the table on the right.
Interpret your results in the context of the research question.
Make reference to the your regression table.
Make sure to include a decision in relation to your null hypothesis - based on the evidence, should you reject or fail to reject the null?
Compile Report
Knit your report to PDF, and check over your work. To do so, you should make sure:
- Only the output you want your reader to see is visible (e.g., do you want to hide your code?)
- Check that the tinytex package is installed
- Ensure that the ‘yaml’ (bit at the very top of your document) looks something like this:
---
title: "this is my report title"
author: "B1234506"
date: "07/09/2024"
output: bookdown::pdf_document2
---If you are having issues knitting directly to PDF, try the following:
- Knit to HTML file
- Open your HTML in a web-browser (e.g. Chrome, Firefox)
- Print to PDF (Ctrl+P, then choose to save to PDF)
- Open file to check formatting
To not show the code of an R code chunk, and only show the output, write:
```{r, echo=FALSE}
# code goes here
```
To show the code of an R code chunk, but hide the output, write:
```{r, results='hide'}
# code goes here
```
To hide both code and output of an R code chunk, write:
```{r, include=FALSE}
# code goes here
```You must make sure you have tinytex installed in R so that you can “Knit” your Rmd document to a PDF file:
install.packages("tinytex")
tinytex::install_tinytex()

