Writing-up
LEARNING OBJECTIVES
- Construct a linear model from information in published paper.
- Evaluate a published analysis with respect to the thoroughness of information presented.
- Write-up and provide interpretation of a linear model analysis with multiple predictors
Write-up task
Here, we’re going to walk through a high-level step-by-step guide of what to include in a write-up of a statistical analysis. We’re going to use an example analysis using one of the datasets we have worked with on a number of exercises in previous labs concerning personality traits, social comparison, and depression and anxiety.
The aim in writing should be that a reader is able to more or less replicate your analyses without referring to your R code. This requires detailing all of the steps you took in conducting the analysis.
The point of using RMarkdown is that you can pull your results directly from the code. If your analysis changes, so does your report!
You can find a .pdf of the take-everywhere write-up checklist here.
Think
What do you know? What do you hope to learn? What did you learn during the exploratory analysis?
If you were reporting on your own study, then the first you would want to describe the study design, the data collection strategy, etc.
This is not necessary here, but we could always say something brief like:
Data was obtained from https://uoepsy.github.io/data/scs_study.csv: a dataset containing information on 656 participants
- How many observational units?
- Are there any observations that have been excluded based on pre-defined criteria? How/why, and how many?
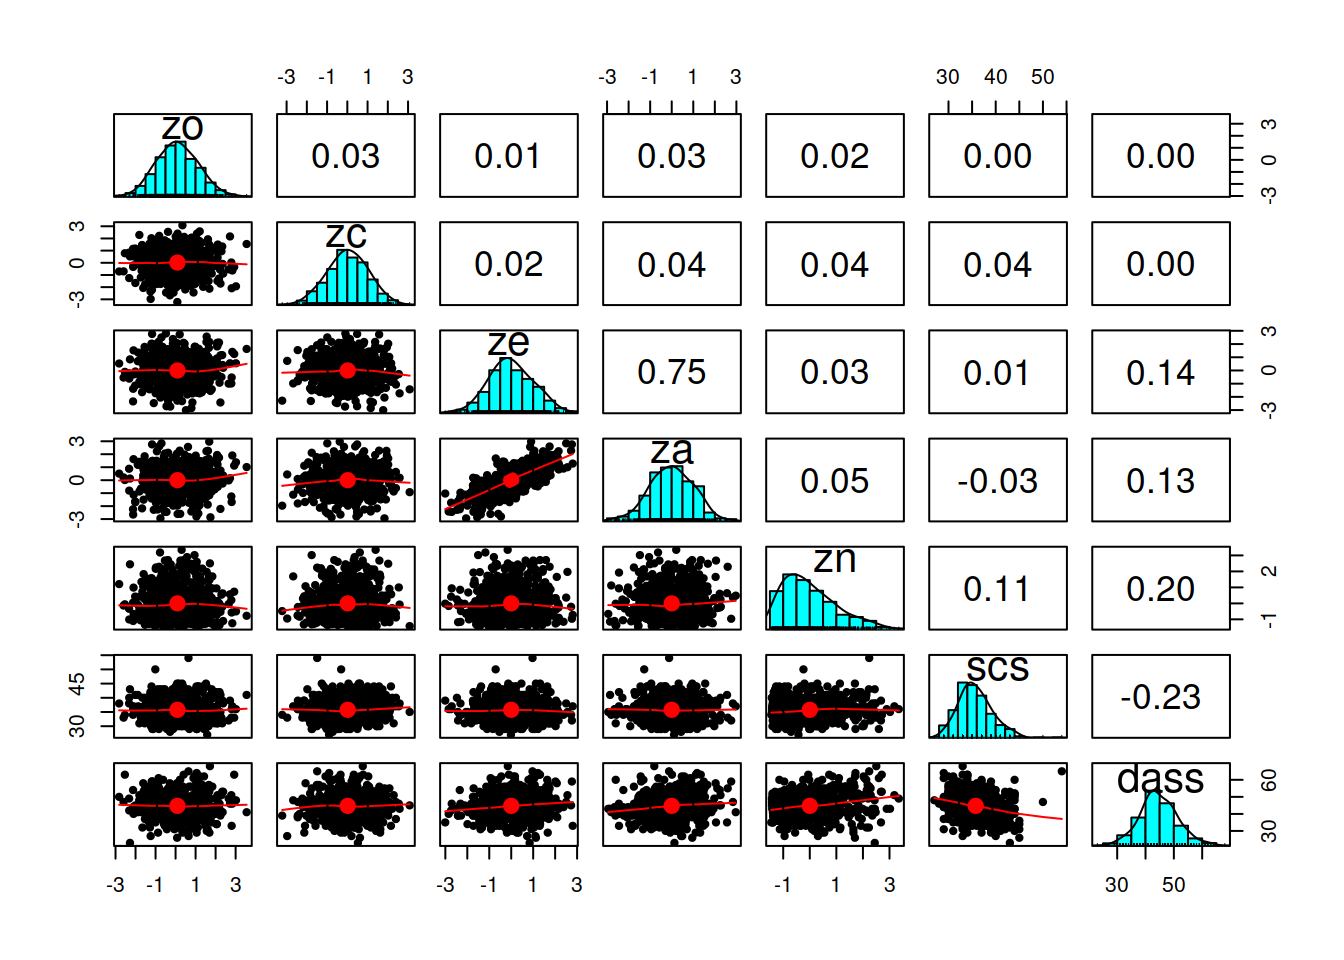
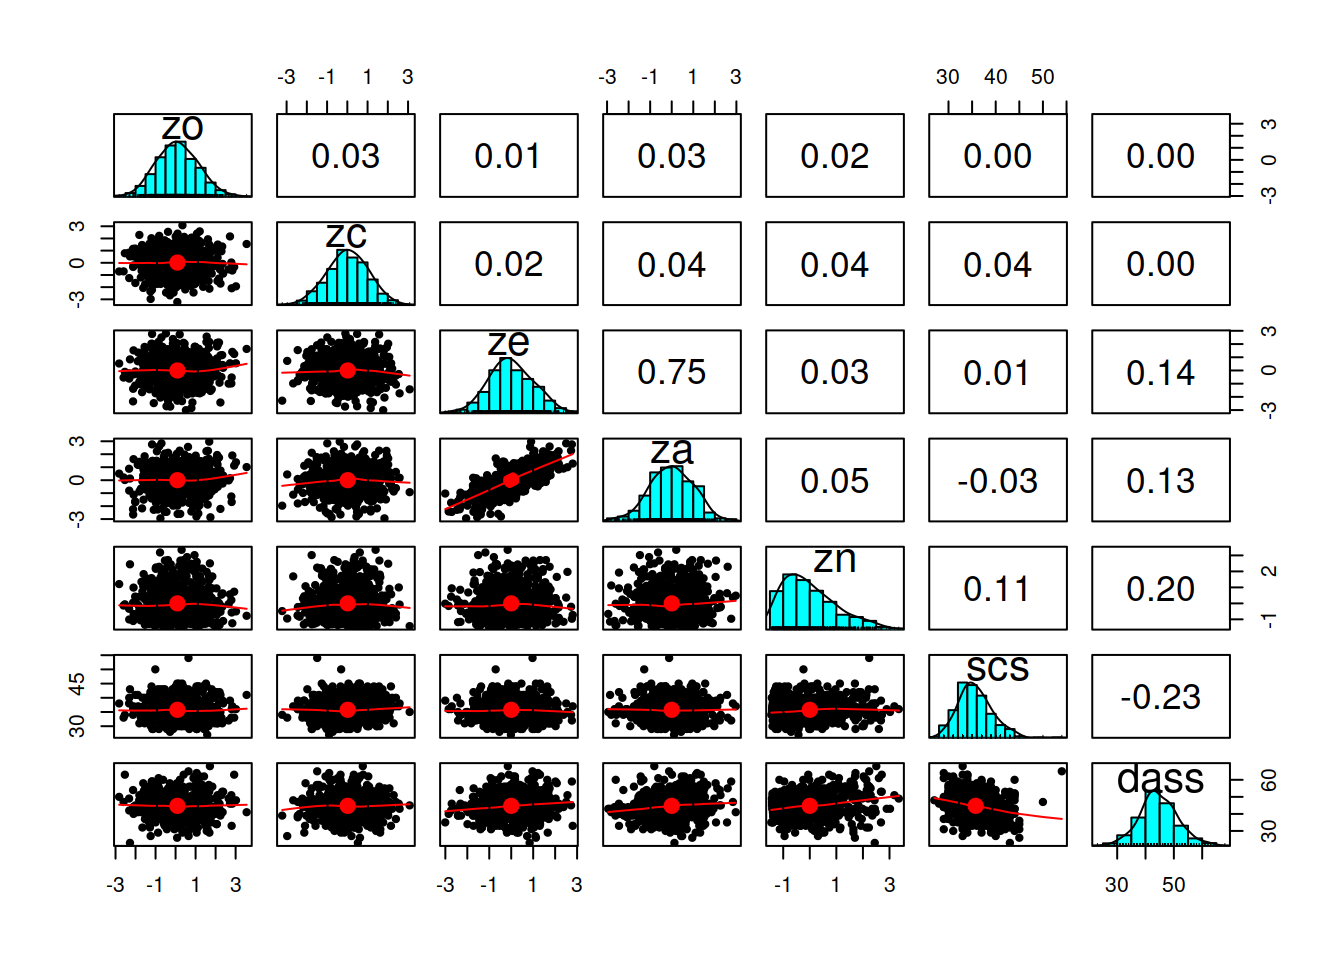
- Describe and visualise the variables of interest. How are they scored? have they been transformed at all?
- Describe and visualise relationships between variables. Report covariances/correlations.
- What type of statistical analysis do you use to answer the research question? (e.g., t-test, simple linear regression, multiple linear regression)
- Describe the model/analysis structure
- What is your outcome variable? What is its type?
- What are your predictors? What are their types?
- Any other specifics?
- Was there anything you had to do differently than planned during the analysis? Did the modelling highlight issues in your data?
- Did you have to do anything (e.g., transform any variables, exclude any observations) in order to meet assumptions?
Show
Show the mechanics and visualisations which will support your conclusions
Present and describe the model or test which you deemed best to answer your question.
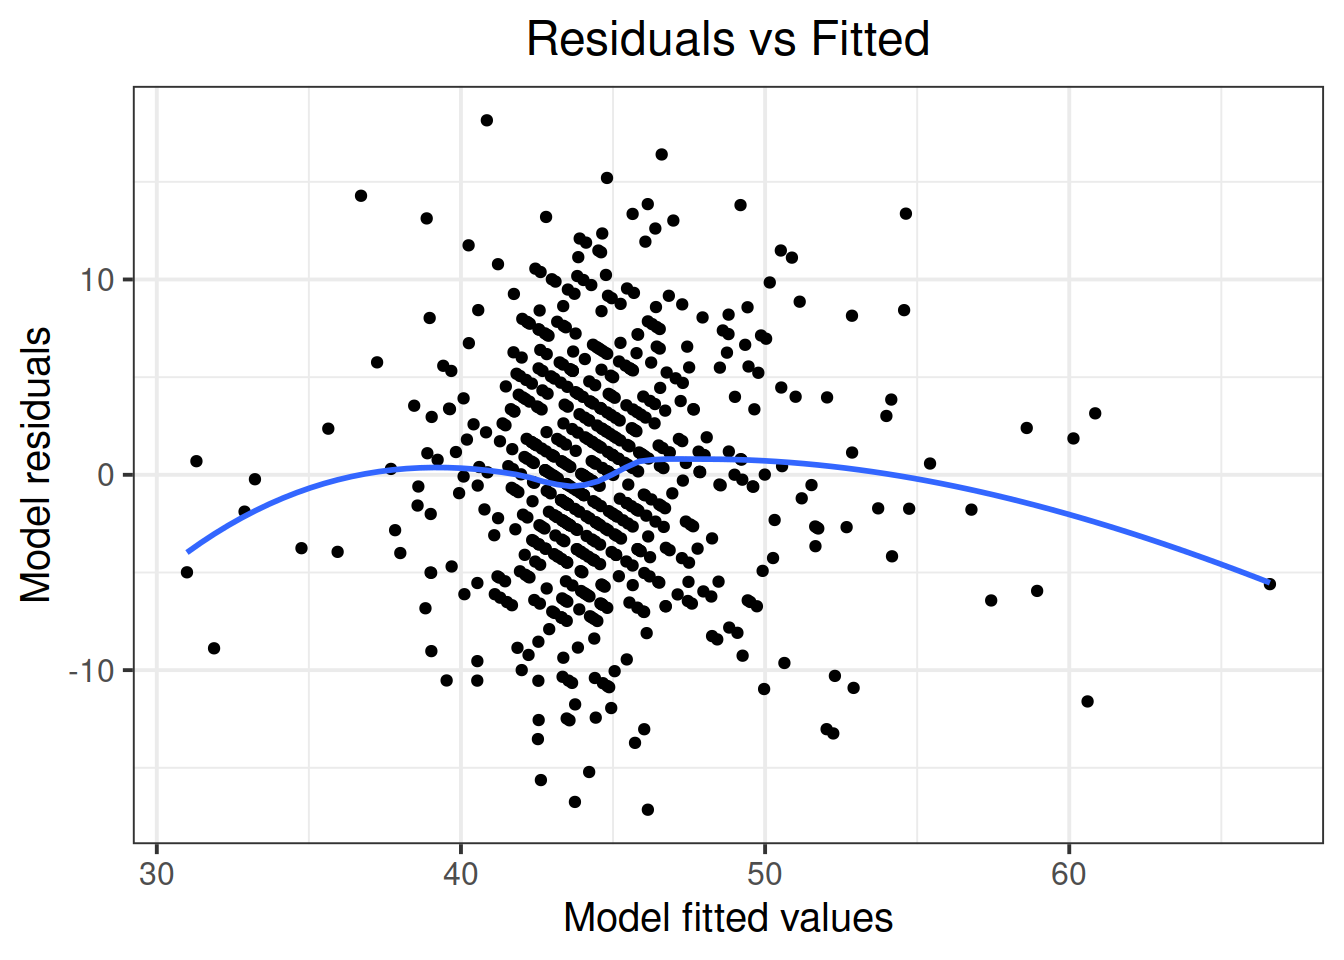
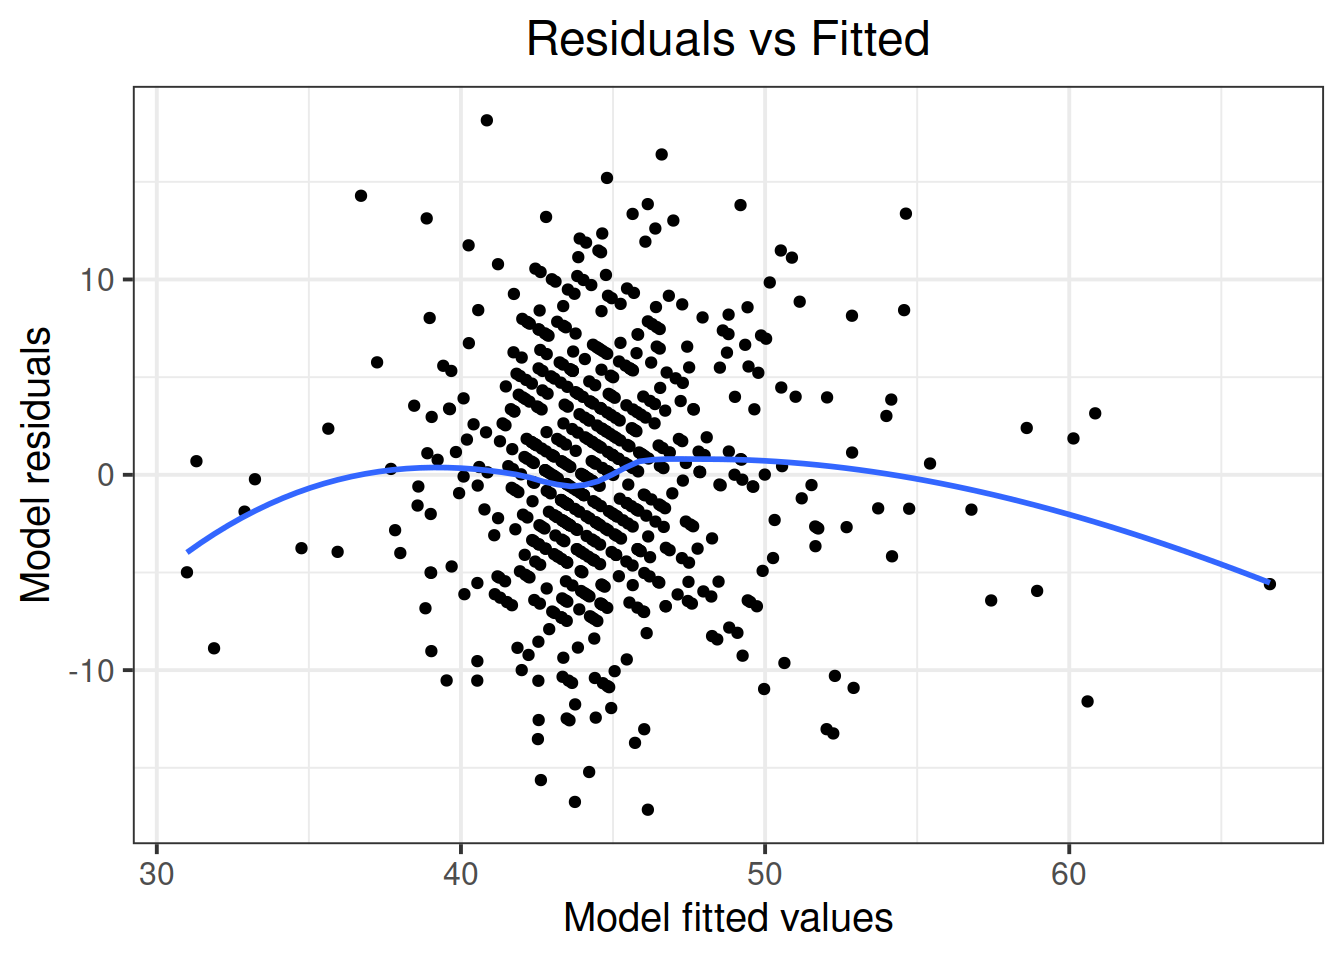
For the final model (the one you report results from), were all assumptions met? (Hopefully yes, or there is more work to do…). Include evidence (tests or plots).
- Provide a table of results if applicable (for regression tables, try
tab_model()from the sjPlot package).
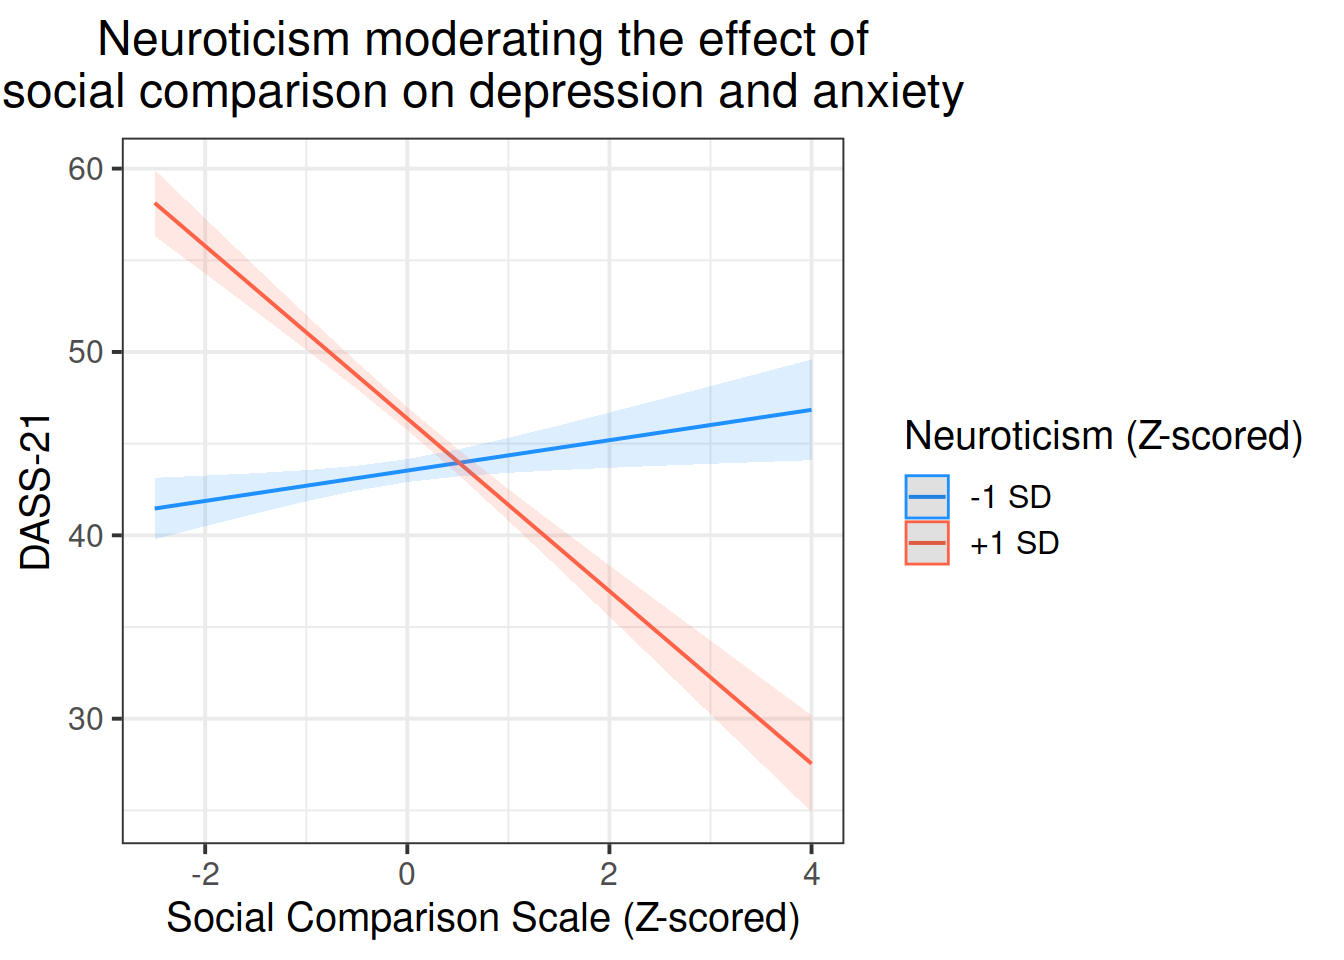
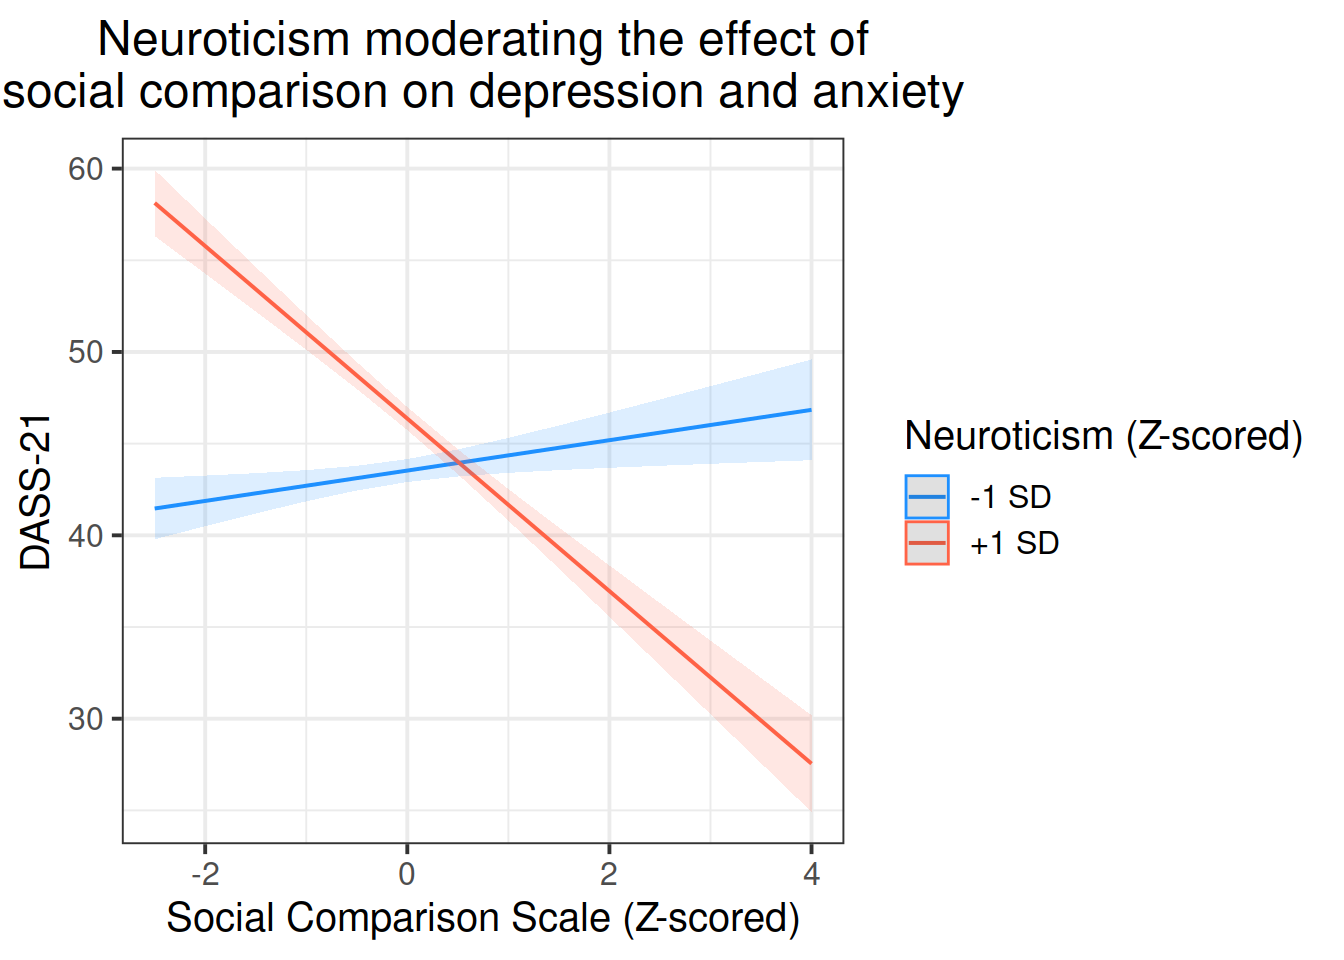
- Provide plots if applicable.
Tell
Communicate your findings
- What do your results suggest about your research question?
- Make direct links from hypotheses to models (which bit is testing hypothesis)
- Be specific - which statistic did you use/what did the statistical test say? Comment on effect sizes.
- Make sure to include measurement units where applicable.
Tying it all together
All the component parts we have just written in the exercises above can be brought together to make a reasonable draft of a statistical report. There is a lot of variability in how to structure the reporting of statistical analyses, for instance you may be using the same model to test a selection of different hypotheses.
The answers contained within the solution box below is just an example. While we hope it is useful for you when you are writing your report, it should not be taken as an exemplary template for a report which would score 100%.
We have also included the RMarkdown file used to create this, which may be useful to see how things such as formatting and using inline R code can be used.
Created with the
pairs.panels()function from the psych package if you’re interested.↩︎


