Categorical predictors and assumptions
Be sure to check the solutions to last week’s exercises.
You can still ask any questions about previous weeks’ materials if things aren’t clear!
LEARNING OBJECTIVES
- Understand the meaning of model coefficients in the case of a binary predictor.
- Be able to state the assumptions underlying a linear model.
- Understand how to assess if a fitted model satisfies the linear model assumptions.
- Understand how to use transformations when the model violates assumptions.
Research question
Do distracting colours influence game completion time?
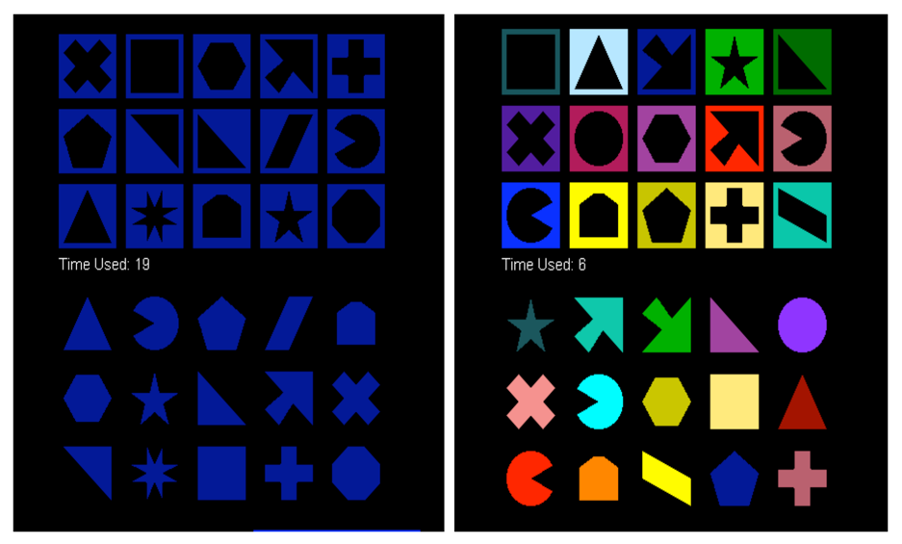
A group of students wanted to answer the above research question. To do so, they designed a standard computerized game and a second version with distracting colours. Time to completion and type of game played were recorded for each study participant. See the data description below for more information.
Data exploration
Read the Perfection game data into R and name the data frame perfection.
Check for the correct encoding of all variables — that is, categorical variables should be factors and numeric variables should be numeric.
Identify the units, the population to which conclusions can be generalised to, the explanatory variable and the response variable. Also classify the variables according to their type.
Is this study an experiment or an observational study?
Display and describe the marginal distribution of game type.
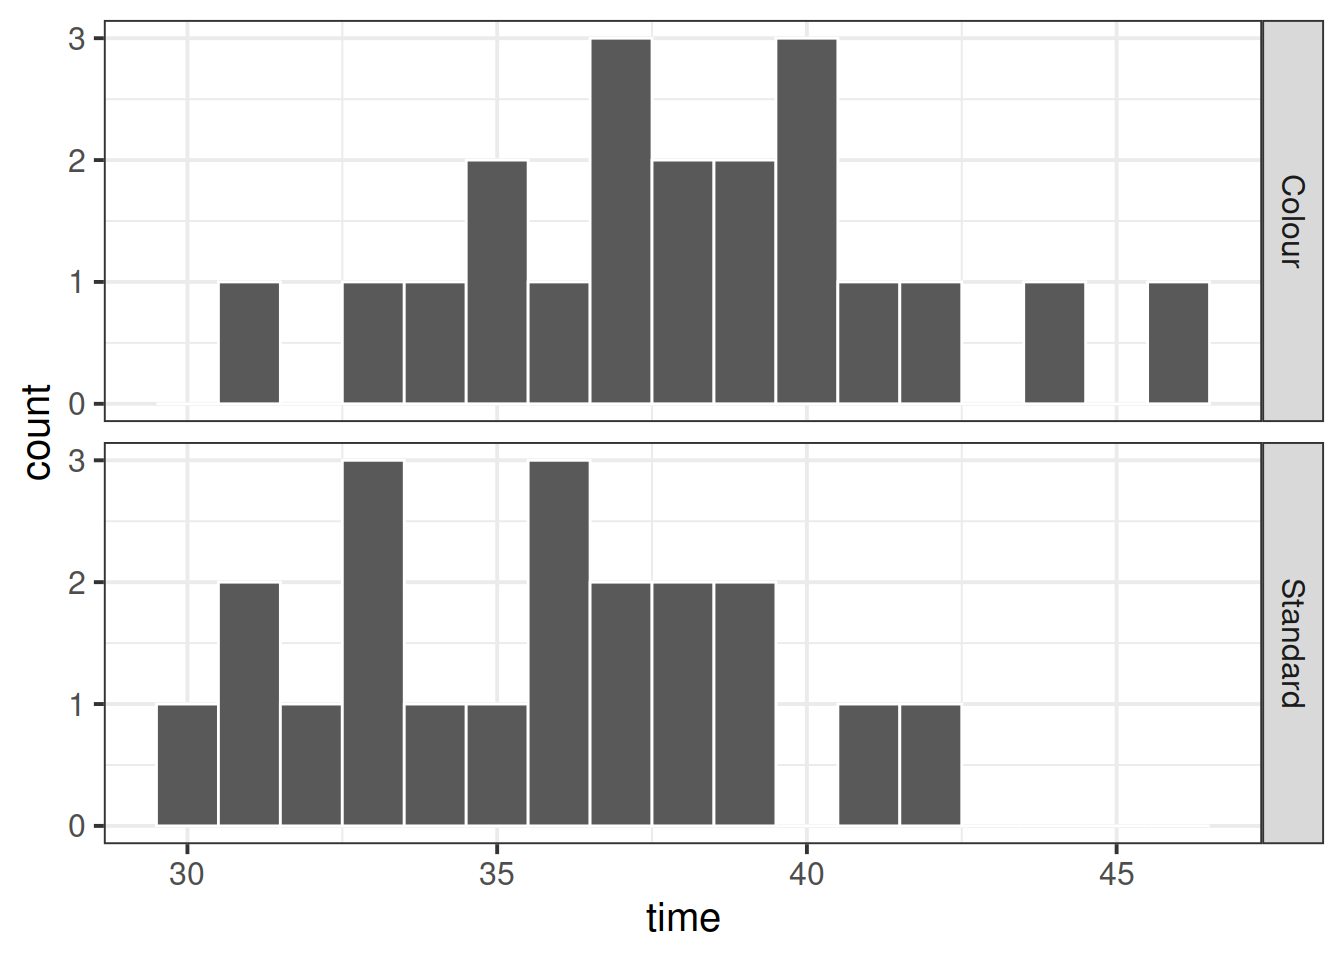
Display and describe the marginal distribution of completion times.
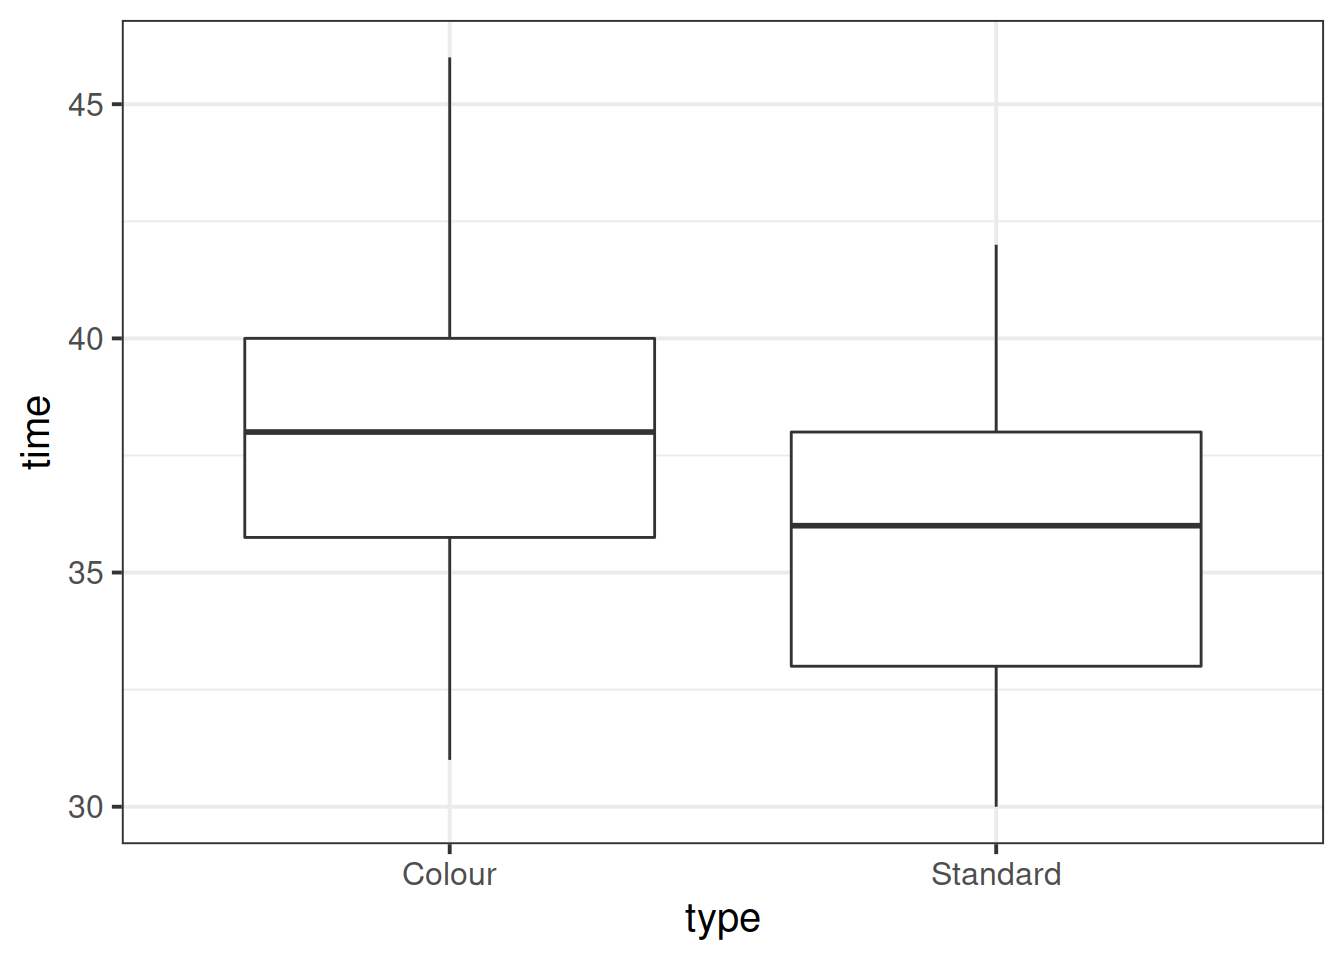
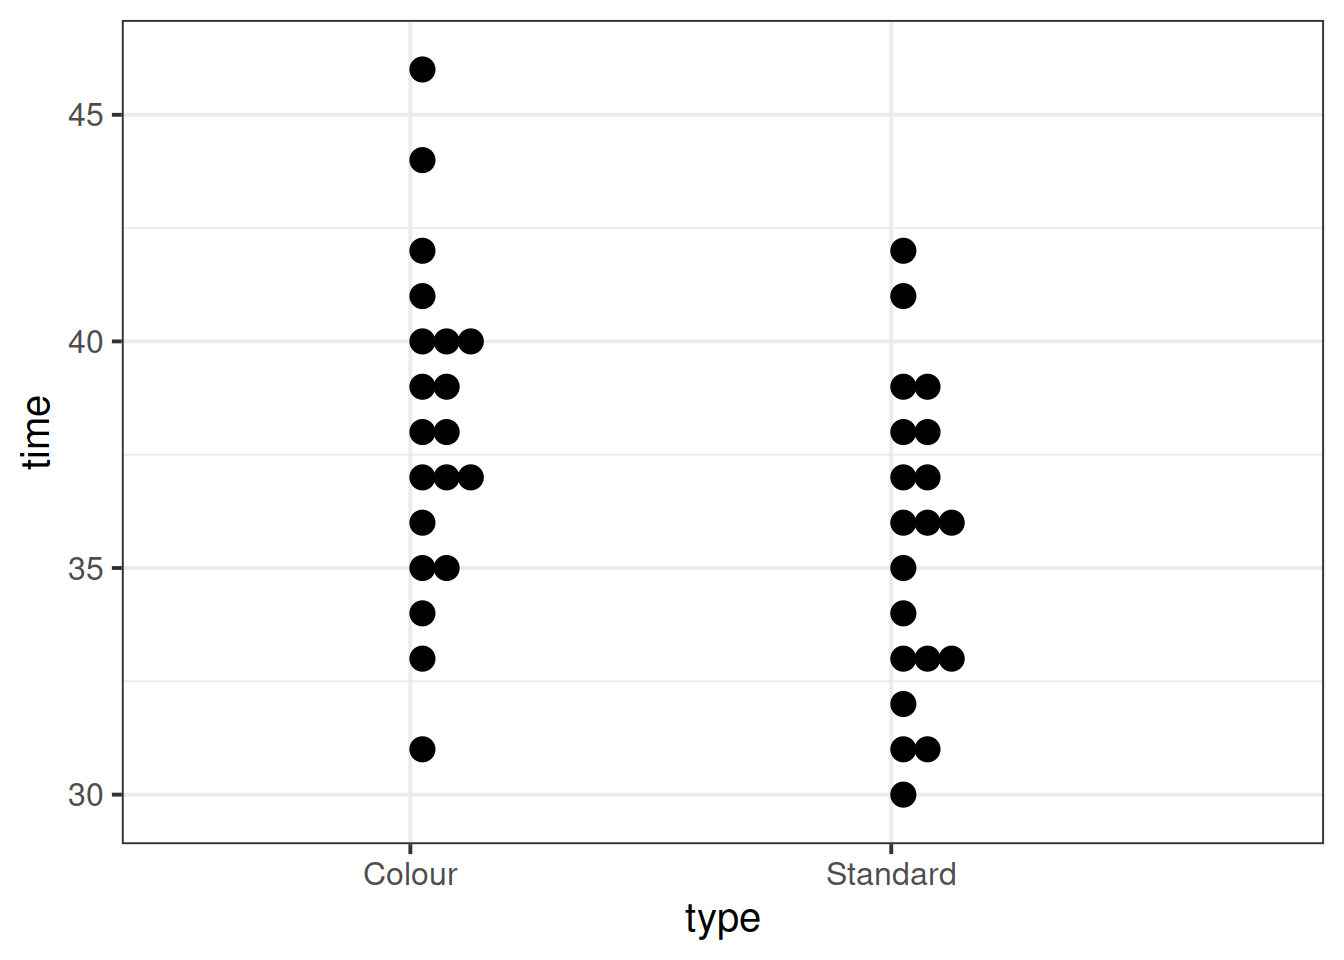
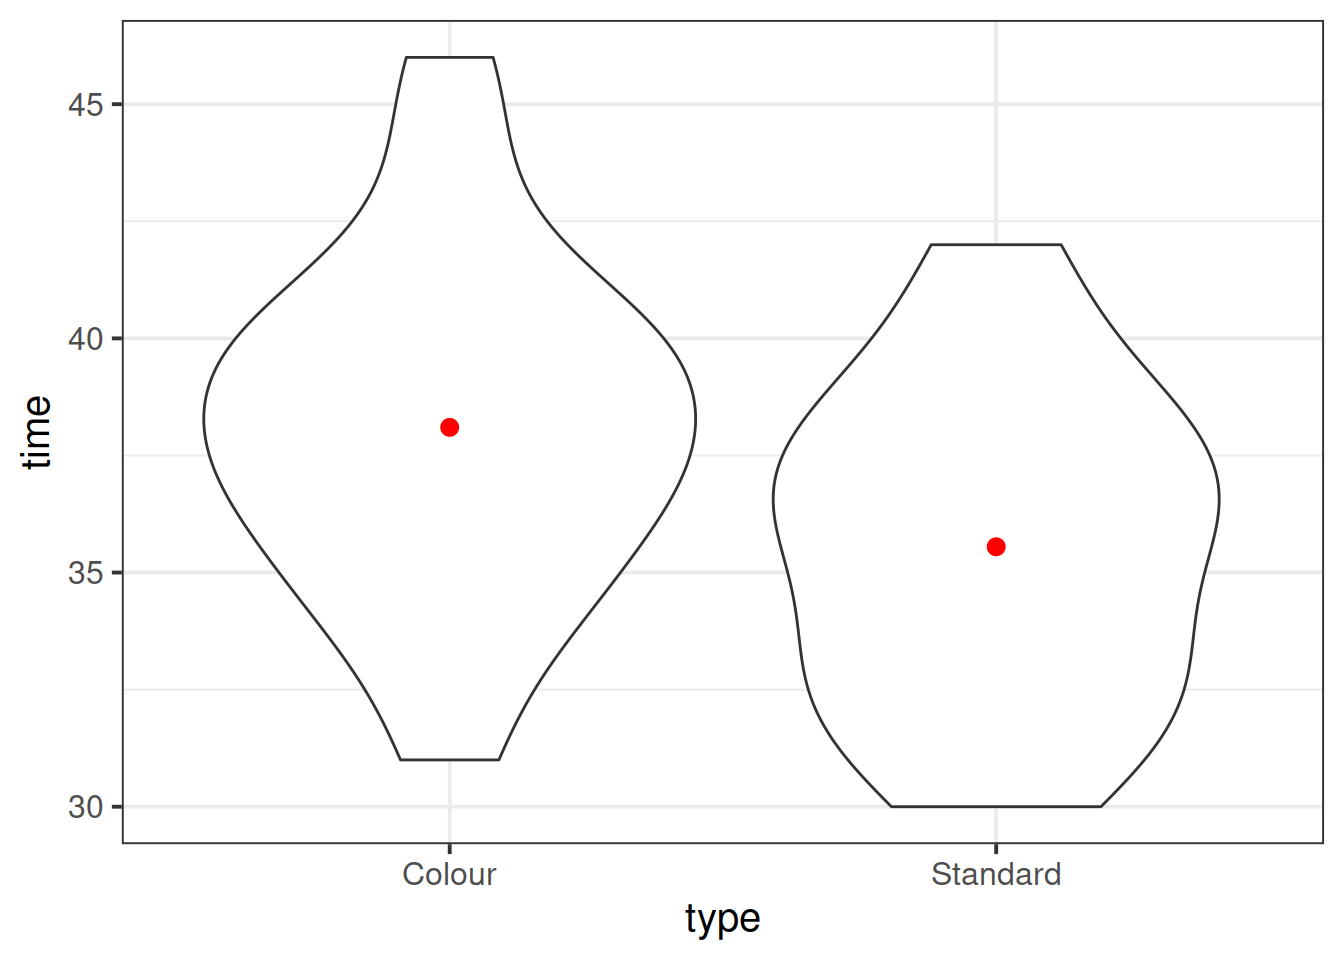
Display and describe the relationship between game type and completion times.
Does it look like the groups have equal mean or spread? Are there any extreme observations?
Model specification and fitting
The researchers hope to determine if distracting colours could impact response times when playing a computerised version of the Perfection game.
Using a two-sided alternative, write out in words and in symbols appropriate null and alternative hypothesis for the research question of interest.
Using the t.test() function, perform a statistical test against the null hypothesis specified above.
Using the linear model function, lm(), fit the following linear model to the Perfection game data:
\[
Time = \beta_0 + \beta_1 \ Type + \epsilon
\]
Write down the equation of the fitted line.
At the 5% significance level, are the regression coefficients significantly different from zero?
Does the model explain a significant fraction of the variability in completion times?
Do you notice any similarities between the results of the two-sample t-test (performed via t.test()) and those of the linear model fitted via lm()?
Interpret the intercept and slope of the fitted regression model.
Assumptions check
The test statistics reported in the model results are based on a series of assumptions. If these assumptions are not satisfied, the results will not hold.
You can remember the four assumptions by memorising the acronym LINE:
- L - Linearity
- I - Independence
- N - Normality
- E - Equal variance
If at least one of these assumptions does not hold, say N - Normality, you might be reporting a LIE.
Check if the fitted model satisfies the linearity assumption.
Hint: An equivalent way to assess this is to check that the errors have a mean of zero. That is, there is no pattern left in the residuals as the systematic trend has entirely been captured by the linear model.
Check if the fitted model satisfies the independent errors assumption.
Check if the fitted model satisfies the normality of the errors assumption.
Check if the fitted model satisfies the equal variance assumption.
References
Perfection is a popular game in which a person is expected to place an assortment of shaped pegs into the matching spaces.↩︎





 The plot above does not highlight any substantial departure from normality.
 The plot above has the points much closer to each other, and all above 0. The spread of the two groups appears pretty similar, and the line connecting the two point clouds seems to be flat (as it should be if the spread was constant).