W11 Exercises
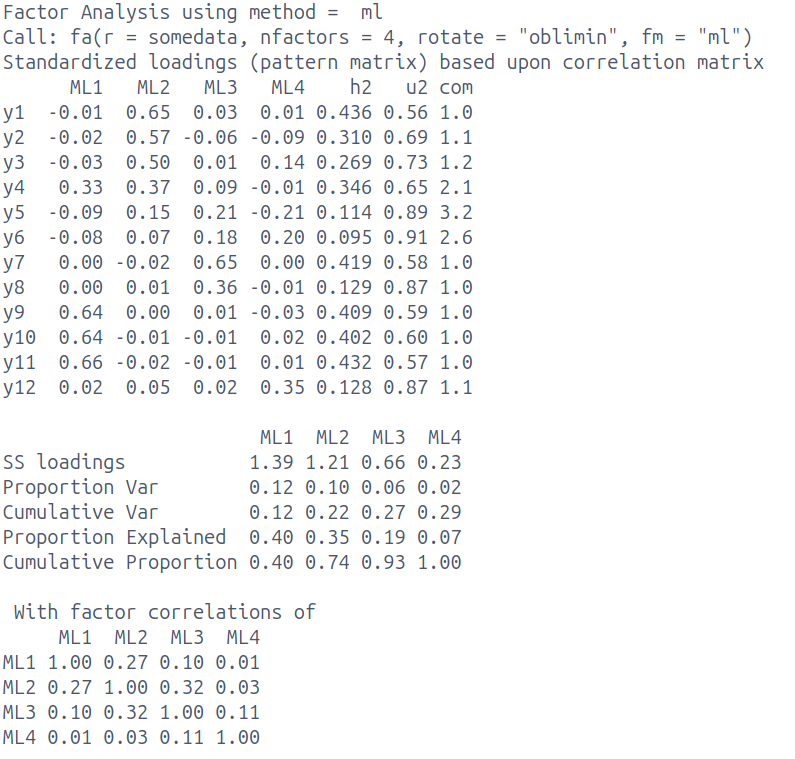
Below are the results of a data reduction of a set of 12 items assessing environmental conscientiousness. Participants are asked to respond to each statement on a 5-point likert scale from “Strongly Disagree” to “Strongly Agree”.
Based on the results and the item descriptions below, provide an interpretation of the factor solution. Your description should include:
- Comment on the numerical solution [6 marks]
- Discussion of suitability of the selected number of factors [6 marks]
- An attempt to define the factors [2 marks]
| item | wording |
|---|---|
| y1 | I recycle regularly |
| y2 | I use eco-friendly transportation |
| y3 | I buy sustainable products |
| y4 | I know how to reduce my carbon footprint |
| y5 | Protecting resources matters to me |
| y6 | I care about protecting the environment |
| item | wording |
|---|---|
| y7 | I feel responsible for my environmental impact |
| y8 | I am worried about climate change effects |
| y9 | I know about the harm of single-use plastics |
| y10 | I know how deforestation affects climate change |
| y11 | I know about relevant environmental policies |
| y12 | Wildlife destruction concerns me deeply |
Calculate the 6 values missing from the table below: SSloadings [2 marks] and proportion variance [2 marks] & cumulative variance [2 marks].
       PC1   PC2
item1 0.90  0.00
item2 0.90 -0.29
item3 0.90  0.30
item4 0.70  0.70
item5 0.81 -0.50
PC1 PC2
SS loadings __ __
Proportion Var __ __
Cumulative Var __ __
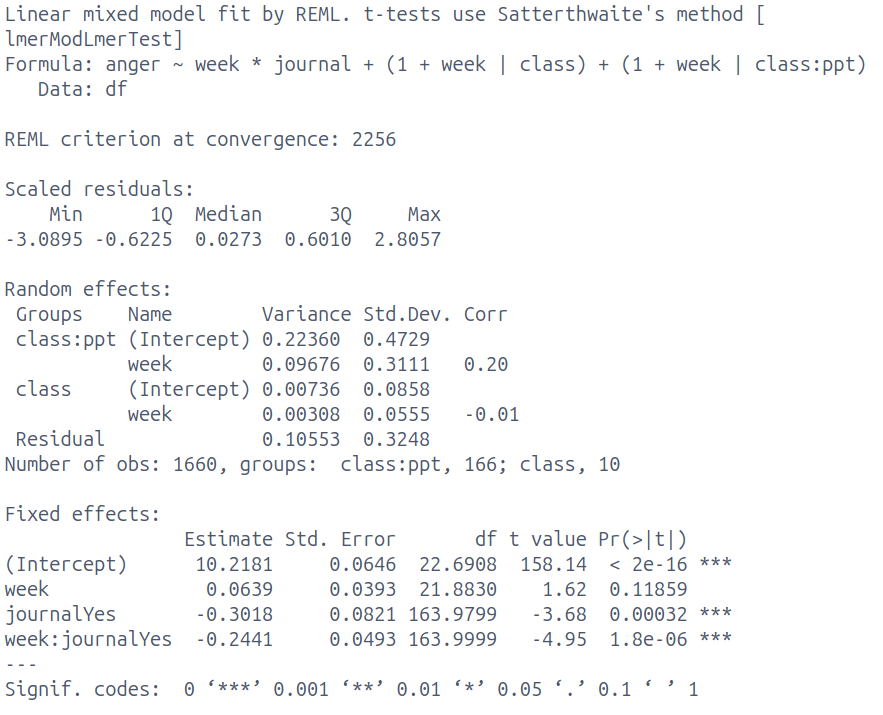
A company that makes “6-minute journals” is undertaking some research to showcase the effectiveness of their product in helping to alleviate unwanted feelings. They recruited 166 people signing up to one of 10 “anger management classes” in different cities, and asked them if they would like to have a free journal to help with reflection. 88 participants chose to take a journal, and 78 did not. Each participant filled out weekly assessments of anger levels for 10 weeks. Scores on the anger measure can range from 0 to 15, with changes of 3 being considered ‘clinically meaningful’.
To investigate if having a journal helps to reduce anger levels, the company fit a multilevel model to the data, with anger levels being modelled by week number (0 to 9, with 0 representing the first week participants filled in the anger assessment), whether the journal was used (“no”/“yes”, with “no” as the reference level).
Provide an interpretation of each of:
- the fixed effects [4 marks]
- the random effects [4 marks]
- the relevance of the findings, considering the context of the study design and researchers’ aims [2 marks]

Provide example levels for each of the three types of study: Cross-Sectional, Repeated Measures, Longitudinal [3 marks]
| level | cross-sectional | repeated measures | longitudinal |
|---|---|---|---|
| 2 | … | … | … |
| 1 | … | … | … |