W7 Exercises: Questionnaire Data & Scale Scores

Dataset: boxbreathe.csv

Researchers are interested in different methods for reducing stress. They recruit 522 participants. All participants first filled out a 6-question measure of stress that is aimed to capture feelings of immediate stress and panic. All questions were scored on a 5-point likert scale from “Strongly Disagree” (1) to “Strongly Agree” (5). To obtain an overall measure of stress, participants’ scores on the 6 questions are added together.

After completing the initial stress measure, participants then completed one of three 5 minute tasks. One third of participants sat in silence for 5 minutes, one third played a picture-matching game on their phone for 5 minutes, and the remaining third completed 5 minutes of “box breathing” (inhale for 6, hold for 4, exhale for 6, hold for 4). After the 5 minutes, all participants filled out the same 6-item measure of stress.

Researchers would like to know whether the different tasks are associated with differences in reduction in stress.

Dataset: https://uoepsy.github.io/data/boxbreathe.csv

variable description
t1_q1 (Time1) I feel a bit on edge right now.
t1_q2 (Time1) I find it hard to focus because of how I'm feeling.
t1_q3 (Time1) I feel like things are getting a little out of control.
t1_q4 (Time1) I feel calm and steady in this moment.
t1_q5 (Time1) I feel capable of managing the situation right now.
t1_q6 (Time1) I feel somewhat restless or unsettled at the moment.
task Task completed (nothing / game / boxbreathing)
t2_q1 (Time2) I feel a bit on edge right now.
t2_q2 (Time2) I find it hard to focus because of how I'm feeling.
t2_q3 (Time2) I feel like things are getting a little out of control.
t2_q4 (Time2) I feel calm and steady in this moment.
t2_q5 (Time2) I feel capable of managing the situation right now.
t2_q6 (Time2) I feel somewhat restless or unsettled at the moment.
Question 1

Read in the data and have a look at it.

  • What does each row represent?
  • What measurement(s) show us a person’s stress?

Here’s the data:

bbdat <- read_csv("https://uoepsy.github.io/data/boxbreathe.csv")
head(bbdat)
# A tibble: 6 × 13
  t1_q1  t1_q2 t1_q3 t1_q4 t1_q5 t1_q6 task  t2_q1 t2_q2 t2_q3 t2_q4 t2_q5 t2_q6
  <chr>  <chr> <chr> <chr> <chr> <chr> <chr> <chr> <chr> <chr> <chr> <chr> <chr>
1 Disag… Neit… Disa… Neit… Neit… Neit… noth… Stro… Neit… Disa… Neit… Neit… Neit…
2 Neith… Agree Agree Disa… Stro… Stro… noth… Agree Agree Agree Disa… Stro… Stro…
3 Neith… Agree Agree Neit… Disa… Agree noth… Agree Agree Agree Neit… Neit… Agree
4 Neith… Disa… Neit… Neit… Neit… Disa… noth… Agree Neit… Neit… Neit… Neit… Neit…
5 Neith… Neit… Neit… Disa… Neit… Neit… noth… Neit… Neit… Neit… Neit… Neit… Agree
6 Stron… Neit… Neit… Disa… Neit… Neit… noth… Stro… Neit… Neit… Neit… Neit… Neit…

Each row is a participant, and we have their stress measured at two time points. We can see that for each person there are 6 columns all measuring the construct of “stress” at each time point.
And for each of those columns, there’s a whole load of words in there!

Question 2

First things first, our questionnaire software has given us the responses all in the descriptors used for each point of the likert scale, which is a bit annoying.
Convert them all to numbers, which we can then work with.

What we have What we want
Strongly Agree 5
Agree 4
Agree 4
Strongly Disagree 1
Neither Disagree nor Agree 3
Agree 4
Disagree 2

We want to turn all of the variables from t1_q1 to t1_q6 and from t2_q1 to t2_q6, into numbers.

To do it with one variable:

bbdat |> mutate(
  t1_q1 = case_match(t1_q1,
                     "Strongly Disagree" ~ 1,
                     "Disagree" ~ 2,
                     "Neither Disagree nor Agree" ~ 3,
                     "Agree" ~ 4,
                     "Strongly Agree" ~ 5
  )
)

And we can do it to all at once with across().
Note we have to specify two sets of columns because there’s a column in the middle (the task column) that we don’t want to do anything to.

bbdat <- bbdat |> mutate(
  across(c(t1_q1:t1_q6, t2_q1:t2_q6),
         ~case_match(.,
                     "Strongly Disagree" ~ 1,
                     "Disagree" ~ 2,
                     "Neither Disagree nor Agree" ~ 3,
                     "Agree" ~ 4,
                     "Strongly Agree" ~ 5
         ))
  )

head(bbdat)
# A tibble: 6 × 13
  t1_q1 t1_q2 t1_q3 t1_q4 t1_q5 t1_q6 task   t2_q1 t2_q2 t2_q3 t2_q4 t2_q5 t2_q6
  <dbl> <dbl> <dbl> <dbl> <dbl> <dbl> <chr>  <dbl> <dbl> <dbl> <dbl> <dbl> <dbl>
1     2     3     2     3     3     3 nothi…     1     3     2     3     3     3
2     3     4     4     2     1     5 nothi…     4     4     4     2     1     5
3     3     4     4     3     2     4 nothi…     4     4     4     3     3     4
4     3     2     3     3     3     2 nothi…     4     3     3     3     3     3
5     3     3     3     2     3     3 nothi…     3     3     3     3     3     4
6     5     3     3     2     3     3 nothi…     5     3     3     3     3     3

Question 3

Just looking at the data at time 1, create a correlation matrix of the various items that measure stress.
What do you notice? Does it make sense given the wording of the questions?

cor(bbdat[,1:6])
       t1_q1  t1_q2  t1_q3  t1_q4  t1_q5  t1_q6
t1_q1  1.000  0.216  0.427 -0.341 -0.369  0.459
t1_q2  0.216  1.000  0.757 -0.709 -0.699  0.723
t1_q3  0.427  0.757  1.000 -0.564 -0.735  0.718
t1_q4 -0.341 -0.709 -0.564  1.000  0.715 -0.568
t1_q5 -0.369 -0.699 -0.735  0.715  1.000 -0.807
t1_q6  0.459  0.723  0.718 -0.568 -0.807  1.000

Correlations are all positive except for those with Q4 and Q5. Q4 and Q5 are positively related, but they are negatively related to the other questions.

This makes sense given the way the questions are worded - if people are feeling stressed, they will be more likely to disagree to Q4 and Q5, but agree with the others:

qitems
[1] "I feel a bit on edge right now."                        
[2] "I find it hard to focus because of how I'm feeling."    
[3] "I feel like things are getting a little out of control."
[4] "I feel calm and steady in this moment."                 
[5] "I feel capable of managing the situation right now."    
[6] "I feel somewhat restless or unsettled at the moment."   

Question 4

Reverse score questions 4 and 5.
We’ll need to do this for both the data at time 1 and at time 2.

  • See R7#reverse-coding
  • Be careful!! if you have some code that reverse scores a question, and you run it twice, you will essentially reverse-reverse score the question, and it goes back to the original ordering!

There’s only 4, so let’s do this individually for each question:

bbdat <- bbdat |> 
  mutate(
    t1_q4 = 6 - t1_q4,
    t1_q5 = 6 - t1_q5,
    t2_q4 = 6 - t2_q4,
    t2_q5 = 6 - t2_q5
)
head(bbdat)
# A tibble: 6 × 13
  t1_q1 t1_q2 t1_q3 t1_q4 t1_q5 t1_q6 task   t2_q1 t2_q2 t2_q3 t2_q4 t2_q5 t2_q6
  <dbl> <dbl> <dbl> <dbl> <dbl> <dbl> <chr>  <dbl> <dbl> <dbl> <dbl> <dbl> <dbl>
1     2     3     2     3     3     3 nothi…     1     3     2     3     3     3
2     3     4     4     4     5     5 nothi…     4     4     4     4     5     5
3     3     4     4     3     4     4 nothi…     4     4     4     3     3     4
4     3     2     3     3     3     2 nothi…     4     3     3     3     3     3
5     3     3     3     4     3     3 nothi…     3     3     3     3     3     4
6     5     3     3     4     3     3 nothi…     5     3     3     3     3     3

Question 5

Take a look at the correlation of the time 1 stress measures again.
What has changed?

The negative correlations are now positive!

cor(bbdat[,1:6])
      t1_q1 t1_q2 t1_q3 t1_q4 t1_q5 t1_q6
t1_q1 1.000 0.216 0.427 0.341 0.369 0.459
t1_q2 0.216 1.000 0.757 0.709 0.699 0.723
t1_q3 0.427 0.757 1.000 0.564 0.735 0.718
t1_q4 0.341 0.709 0.564 1.000 0.715 0.568
t1_q5 0.369 0.699 0.735 0.715 1.000 0.807
t1_q6 0.459 0.723 0.718 0.568 0.807 1.000

Question 6

We’re finally getting somewhere! Let’s create a score for “stress” at time 1, and a score for “stress” at time 2.

The description of the questionnaire says that we should take the sum of the scores on each question, to get an overall measure of stress.

The function rowSums() should help us here! See an example in R7#row-scoring

bbdat$t1_stress <- rowSums(bbdat[,1:6])
bbdat$t2_stress <- rowSums(bbdat[,8:13])

Question 7

Make a new column that represents the change in stress for each person between the two timepoints.

bbdat$stress_change <- bbdat$t2_stress - bbdat$t1_stress

Question 8

Provide some descriptive statistics for the stress scores at time 1 and at time 2, and of the ‘change in stress’ measure.

The describe() function from the psych package is often pretty useful for this kind of thing

library(psych)
bbdat |> 
  select(t1_stress, t2_stress, stress_change) |>
  describe()
              vars   n  mean   sd median trimmed  mad min max range  skew
t1_stress        1 522 17.84 4.61     18   17.88 4.45   7  30    23 -0.06
t2_stress        2 522 17.77 4.55     18   17.78 4.45   6  30    24 -0.03
stress_change    3 522 -0.07 1.02      0   -0.04 1.48  -3   3     6 -0.11
              kurtosis   se
t1_stress        -0.32 0.20
t2_stress        -0.40 0.20
stress_change    -0.08 0.04

Question 9

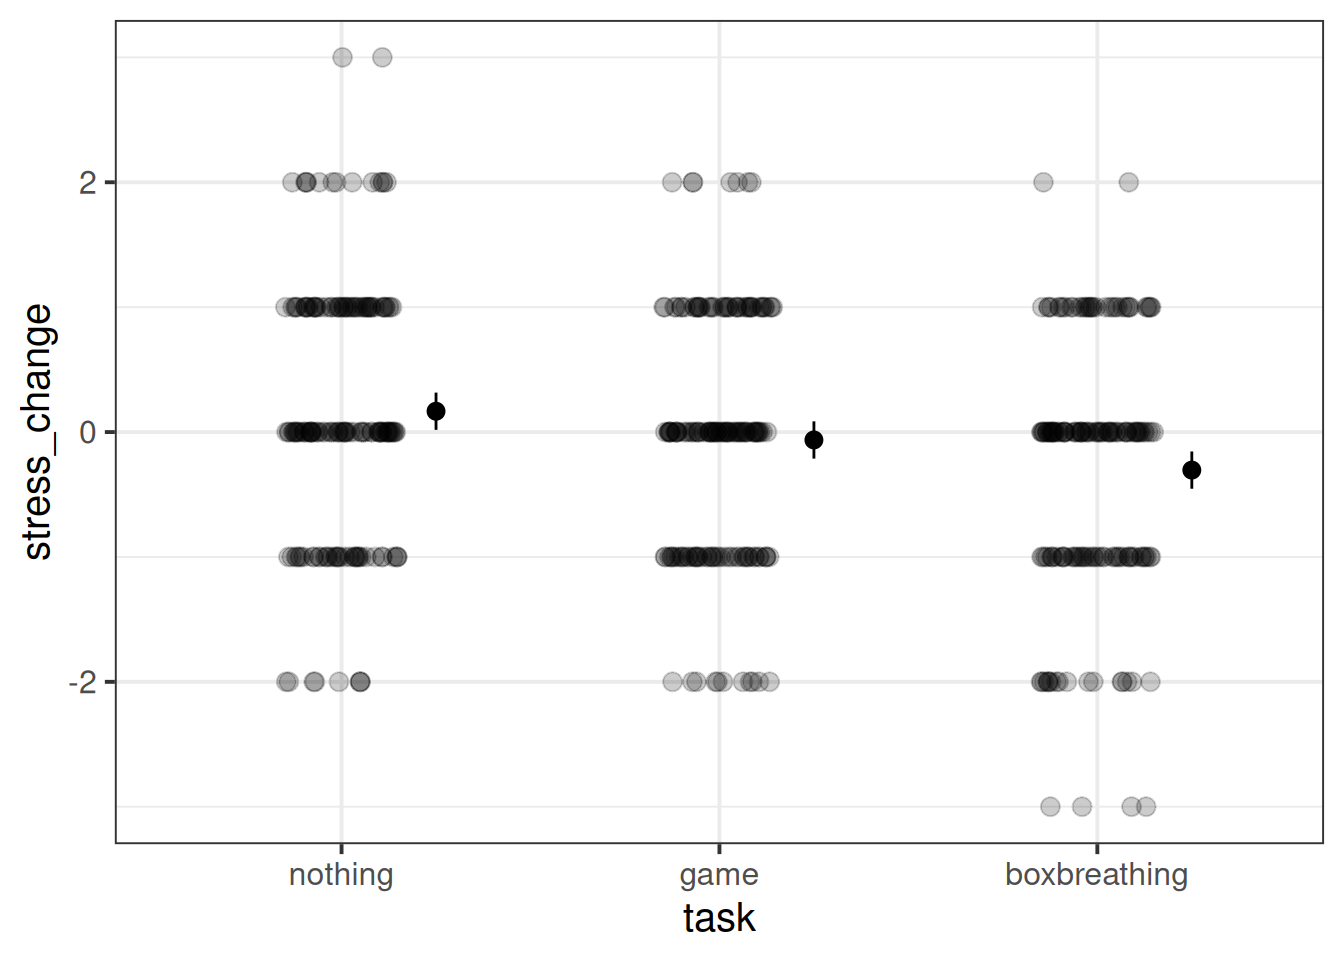
Plot the stress-change for each group of participants.
Fit a linear model to investigate whether the different techniques (the timer game and the box-breathing) are associated with differences in stress change.

It makes more sense to think of “nothing” as the reference level, so let’s make that happen:

bbdat <- bbdat |>
  mutate(
    task = factor(task, levels=c("nothing","game","boxbreathing"))
  )

mod1 <- lm(stress_change ~ task, data = bbdat) 

summary(mod1)

Call:
lm(formula = stress_change ~ task, data = bbdat)

Residuals:
    Min      1Q  Median      3Q     Max 
-2.6954 -0.6954  0.0632  0.8333  2.8333 

Coefficients:
                 Estimate Std. Error t value Pr(>|t|)    
(Intercept)         0.167      0.076    2.19    0.029 *  
taskgame           -0.230      0.107   -2.14    0.033 *  
taskboxbreathing   -0.471      0.107   -4.39  1.4e-05 ***
---
Signif. codes:  0 '***' 0.001 '**' 0.01 '*' 0.05 '.' 0.1 ' ' 1

Residual standard error: 1 on 519 degrees of freedom
Multiple R-squared:  0.0357,    Adjusted R-squared:  0.032 
F-statistic: 9.62 on 2 and 519 DF,  p-value: 7.9e-05

We can make a nice plot of the data, alongside our model estimates. We can actually use the effects() package here too, just like we did for lmer().

# plot the data
ggplot(bbdat, aes(x = task, y = stress_change)) + 
  # jittered points
  geom_jitter(width=.15, height=0, alpha=.2, size = 3) +
  # plot the model estimated means and CIs:
  geom_pointrange(
    data = effects::effect("task", mod1) |> as.data.frame(),
    aes(y=fit,ymin=lower,ymax=upper),
    position = position_nudge(x=.25)
  )