Explore a normally-distributed variable
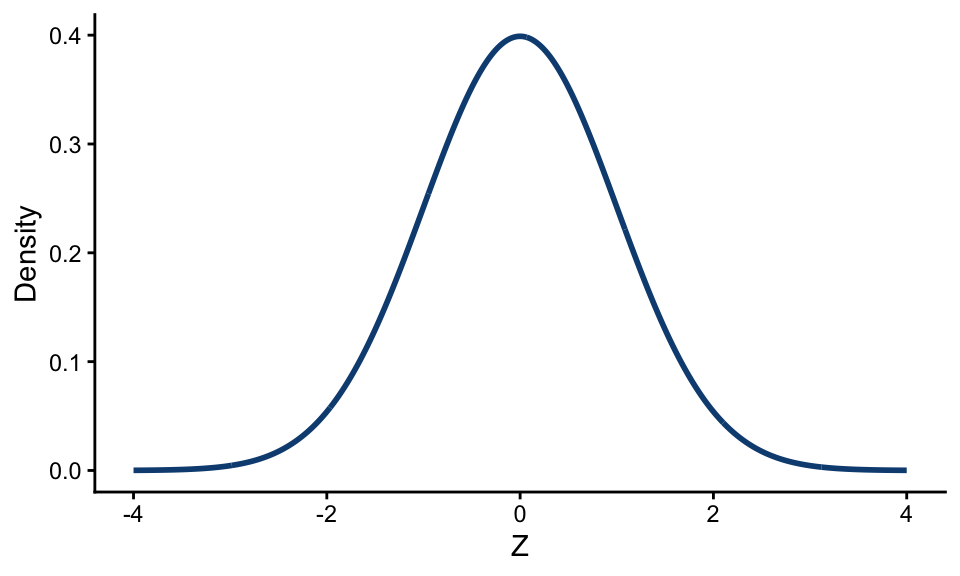
For the purposes of DAPR1, you can assume that if we convert a variable into z-scores, that new z-scored variable follows a normal distribution with mean 0 and SD 1.
A normal distribution with these parameters is called a “standard normal distribution”. Here’s what it looks like.
What’s the probability of a value falling above/below some specific z-score?
Probability corresponds to the area under the standard normal distribution.
To find the proportion of the area under the distribution that falls above or below some given z-score, we use the function pnorm().
Probability below a given z-score
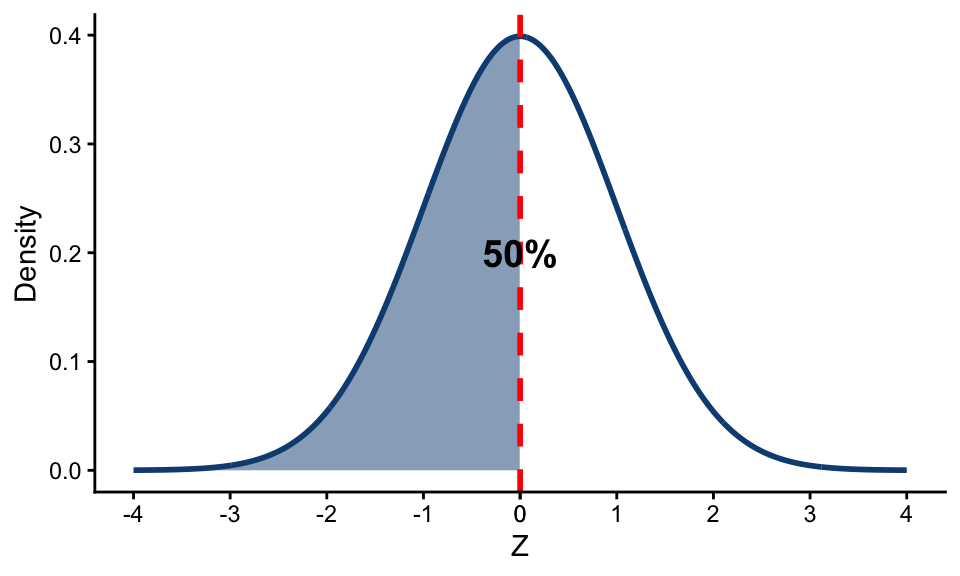
What amount of the area under the distribution—that is, what probability—falls below a z-score of 0?
pnorm(0)[1] 0.5.5 of the total area under the curve, or a probability of 50%.
Visually:
How much probability falls below a z-score of 1.5?
pnorm(1.5)[1] 0.933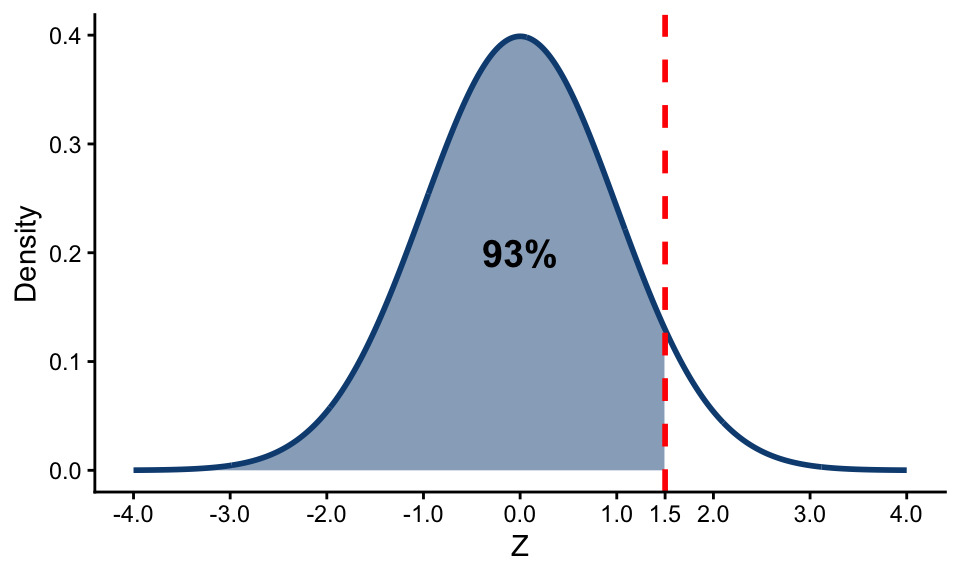
Probability above a given z-score
By default, pnorm() gives us the probability below / to the left of the given z-score.
To find the probability above / to the right of that z-score, we subtract the output of pnorm() from 1.
For example, how much probability falls above a z-score of 1.5? (It should be the approx 7% left over from the 93% in the plot just above.)
1 - pnorm(1.5)[1] 0.0668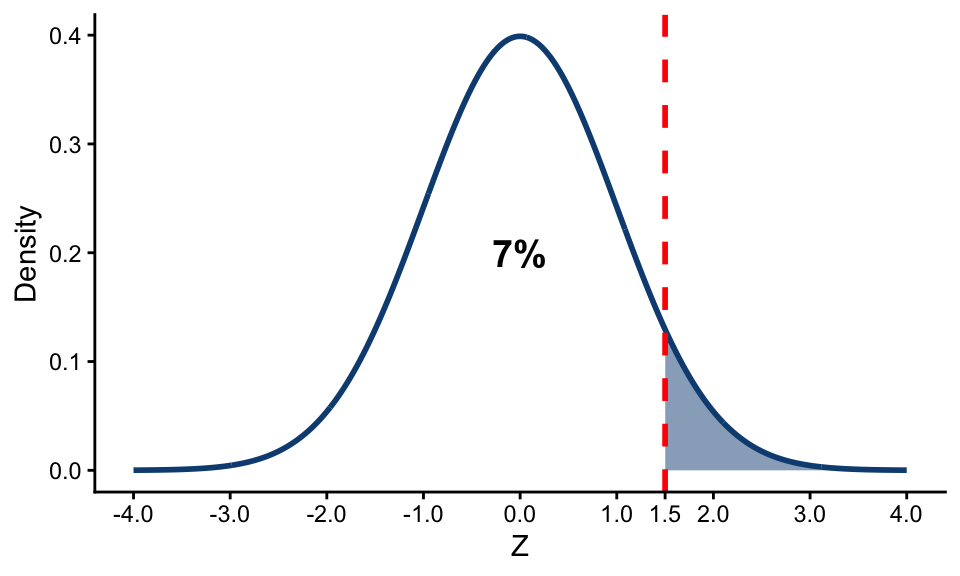
What z-score has a specific probability of values falling above/below it?
This question is asking about the quantile of the probability distribution.
To find the z-score at a given quantile of the distribution—that is, where a given amount of probability falls above or below it—use qnorm().
qnorm() takes a probability and tells you the exact z-score where the area under the standard normal curve reaches that amount.
Z-score with given probability below it
50% of the standard normal distribution falls below / to the left of what z-score?
qnorm(.5)[1] 0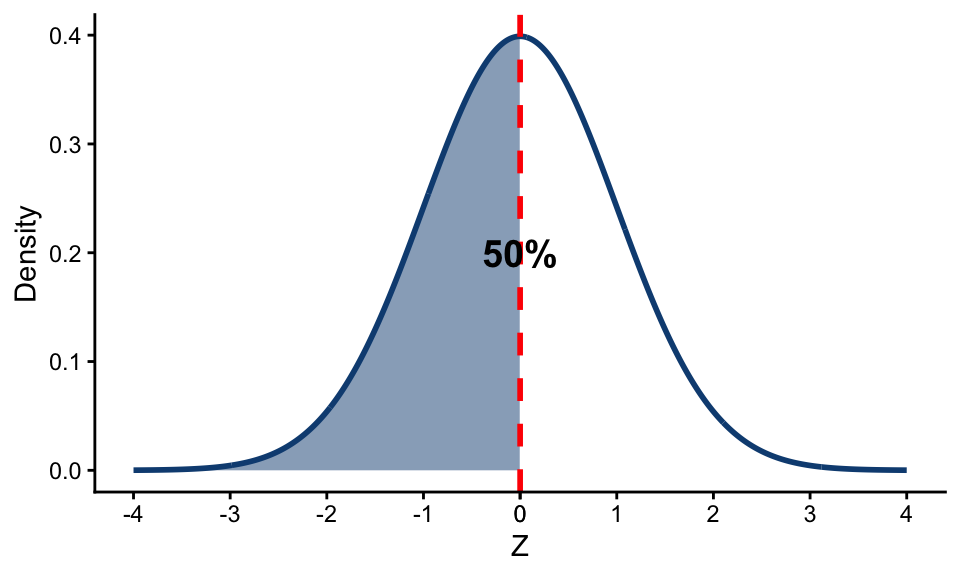
30% of the standard normal distribution falls below / to the left of what z-score?
qnorm(.3)[1] -0.524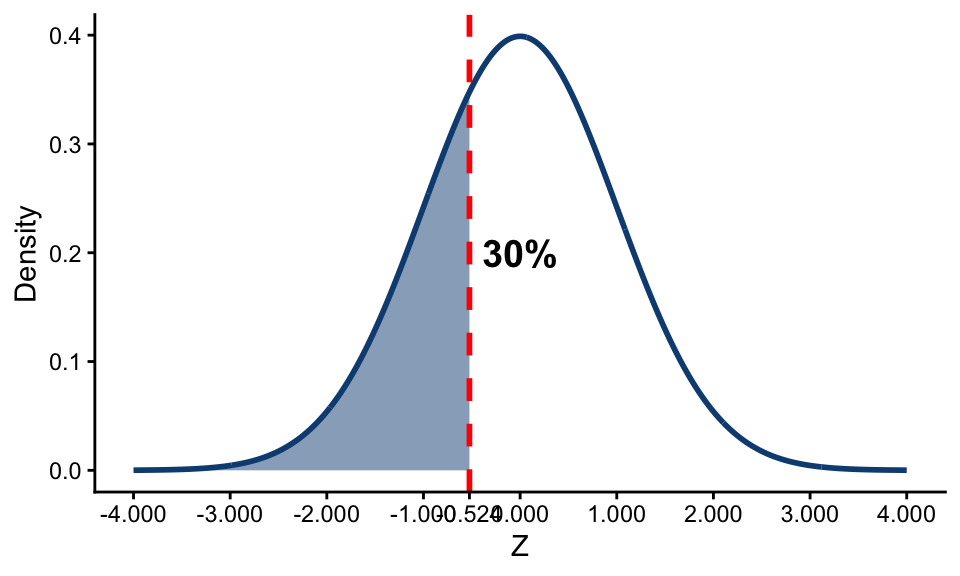
Z-score with given probability above it
By default, qnorm() gives us the quantile with the given probability below / to the left of it.
To find the quantile where the probability falls above / to the right of it, we take 1, subtract from that the probability we’re using, and give that to qnorm():
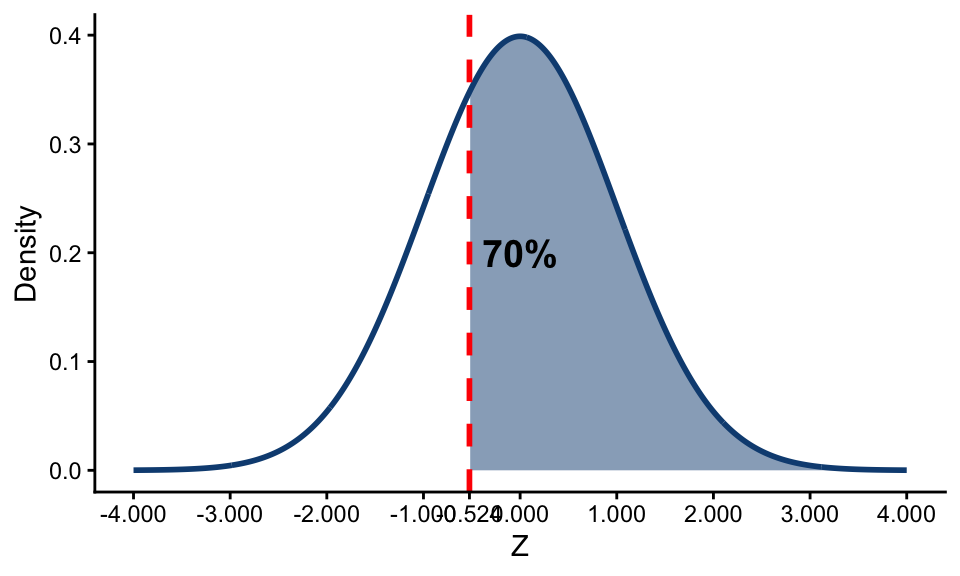
For example, what’s the z-score that has 70% probability above it? (Should be the same z-score as in the plot just above!)
qnorm(1 - .7)[1] -0.524Or you can compute this difference in your head and input the result directly into qnorm():
qnorm(.3)[1] -0.524