We’ll use the msleep dataset that comes from tidyverse. msleep contains some data about how much different kinds of mammals sleep. Here’s what the first few rows of msleep look like.
msleep |>head()
# A tibble: 6 x 11
  name    genus vore  order conservation sleep_total sleep_rem sleep_cycle awake
  <chr>   <chr> <chr> <chr> <chr>              <dbl>     <dbl>       <dbl> <dbl>
1 Cheetah Acin~ carni Carn~ lc                  12.1      NA        NA      11.9
2 Owl mo~ Aotus omni  Prim~ <NA>                17         1.8      NA       7
3 Mounta~ Aplo~ herbi Rode~ nt                  14.4       2.4      NA       9.6
4 Greate~ Blar~ omni  Sori~ lc                  14.9       2.3       0.133   9.1
5 Cow     Bos   herbi Arti~ domesticated         4         0.7       0.667  20
6 Three-~ Brad~ herbi Pilo~ <NA>                14.4       2.2       0.767   9.6
# i 2 more variables: brainwt <dbl>, bodywt <dbl>
Load library
You’ll need to (install and) load the library patchwork.
library(patchwork)
Make plots
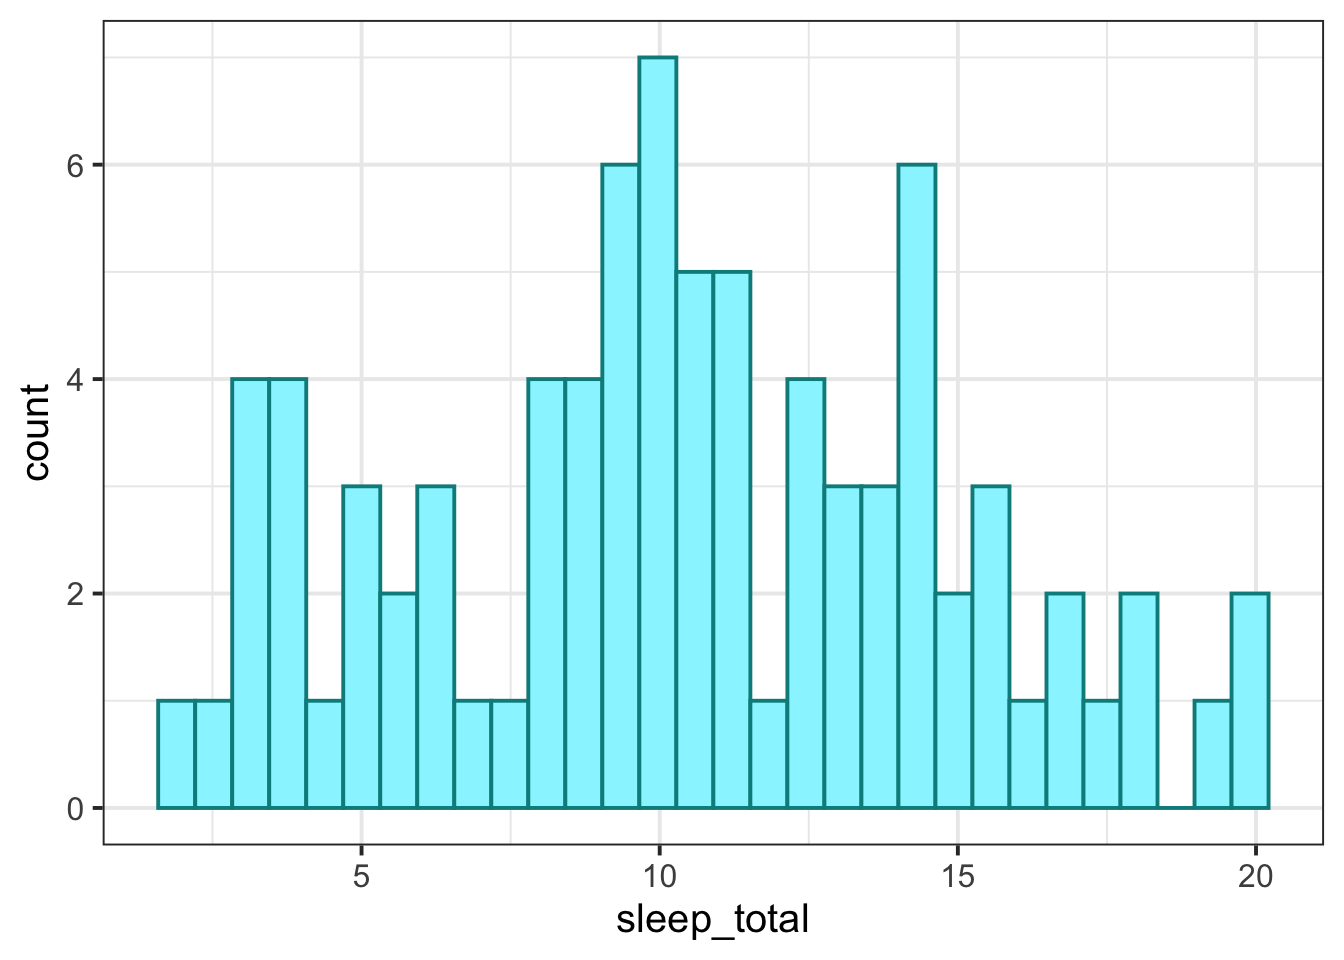
Let’s say we want to combine these two plots into a single graphic.
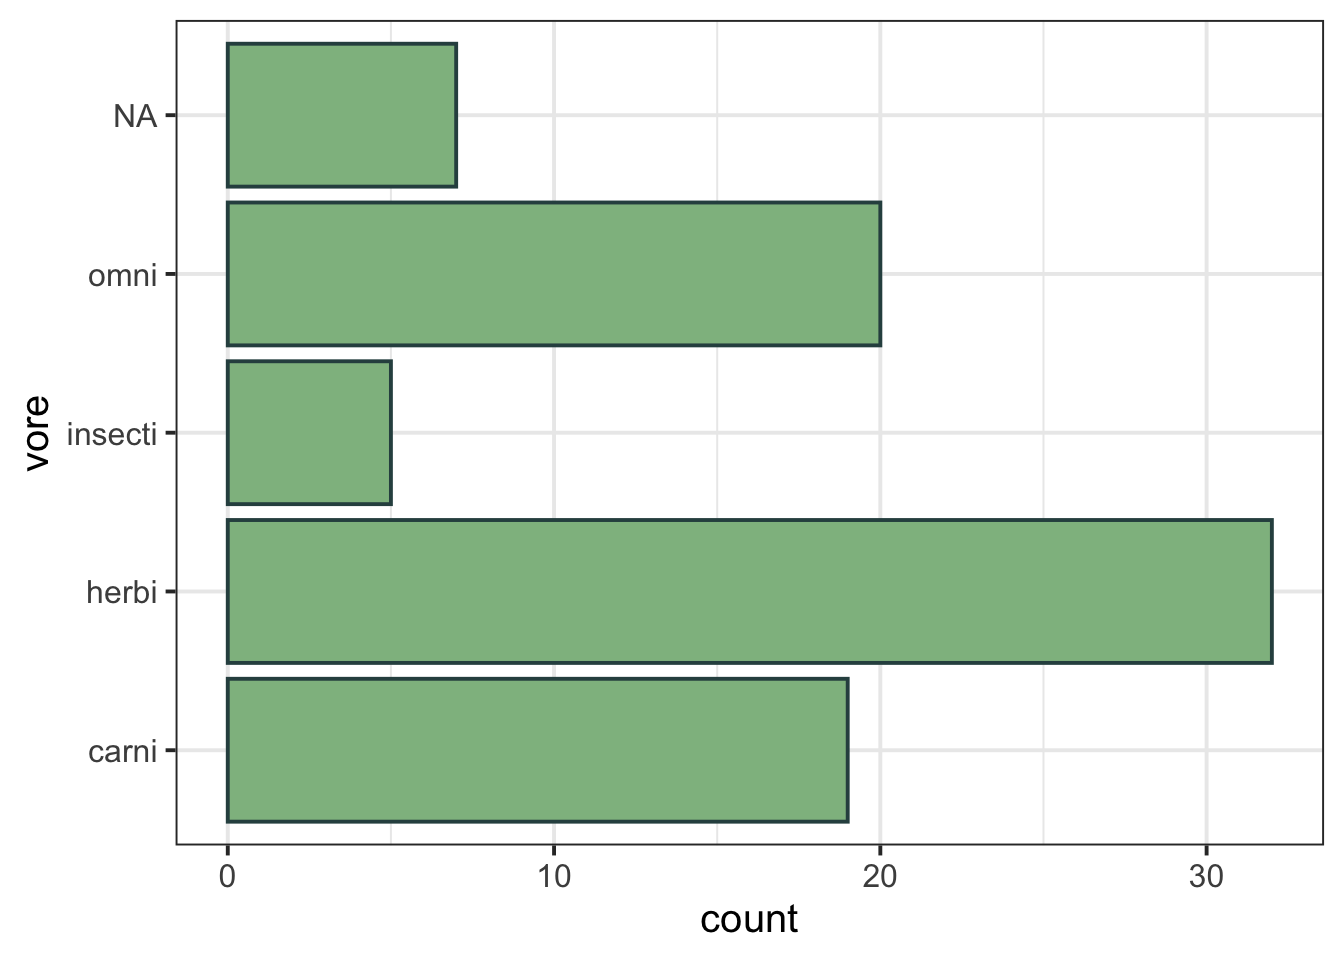
The first plot:
msleep |>ggplot(aes(y = vore)) +geom_bar(colour ='darkslategray', fill ='darkseagreen')
To patchwork two plots together, you’ll first need to store each of the plots under their own name, for example:
# the first plotplot_vorebar <- msleep |>ggplot(aes(y = vore)) +geom_bar(colour ='darkslategray', fill ='darkseagreen')# the second plotplot_sleephist <- msleep |>ggplot(aes(x = sleep_total)) +geom_histogram(fill ='cadetblue1', colour ='cyan4')
Side by side
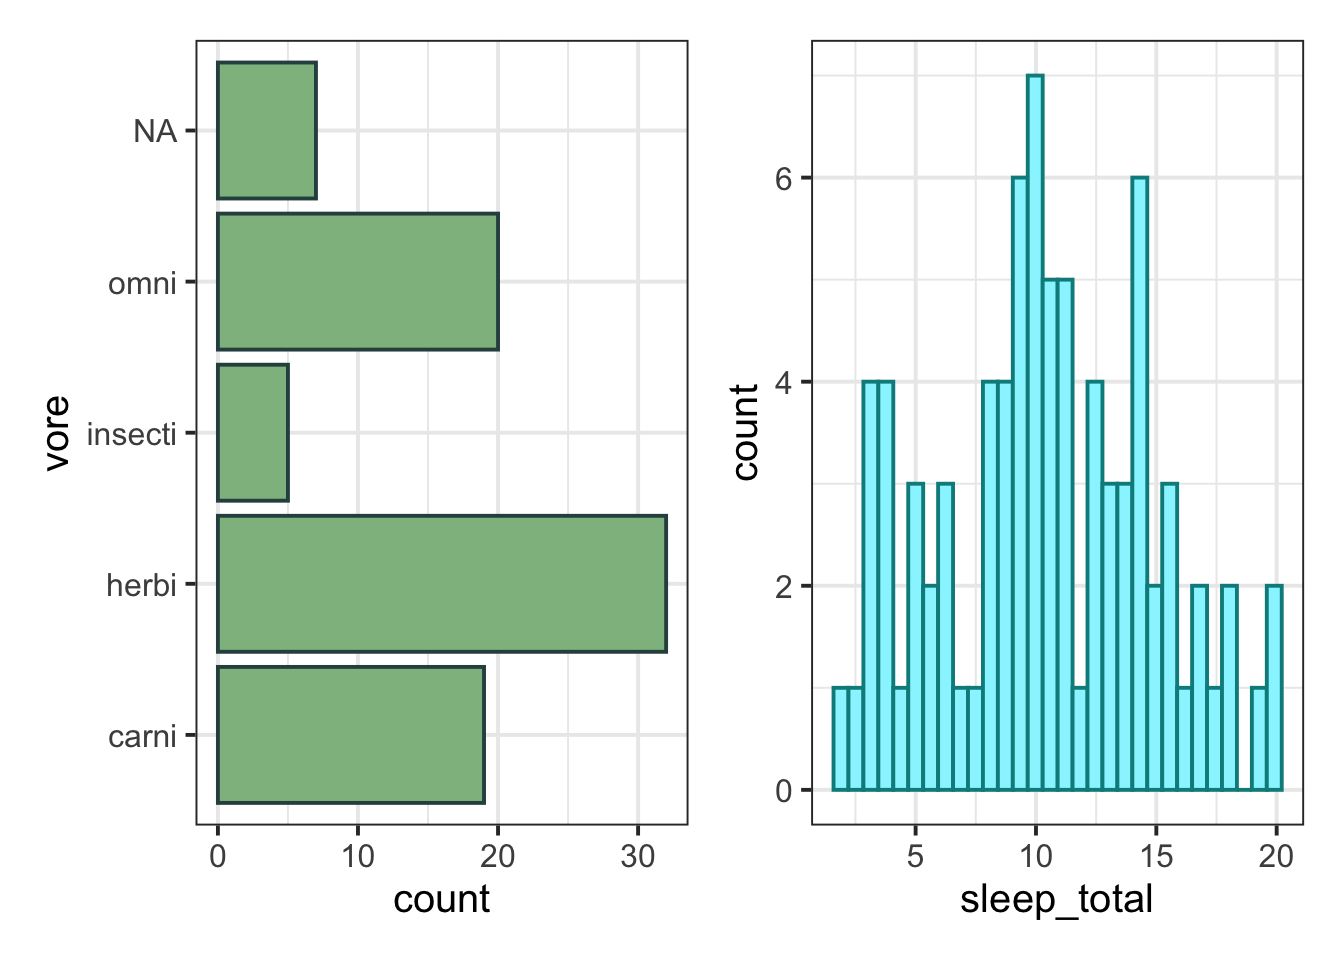
Then as long as you’ve got the patchwork library loaded, you can write the two names with a + sign in between, and you’ll get the two plots placed side by side:
# the first plot + the second plotplot_vorebar + plot_sleephist
(If patchwork is not loaded, you’ll get an error about bad use of arithmetic operator, because R won’t know how to handle the + sign.)
One above the other
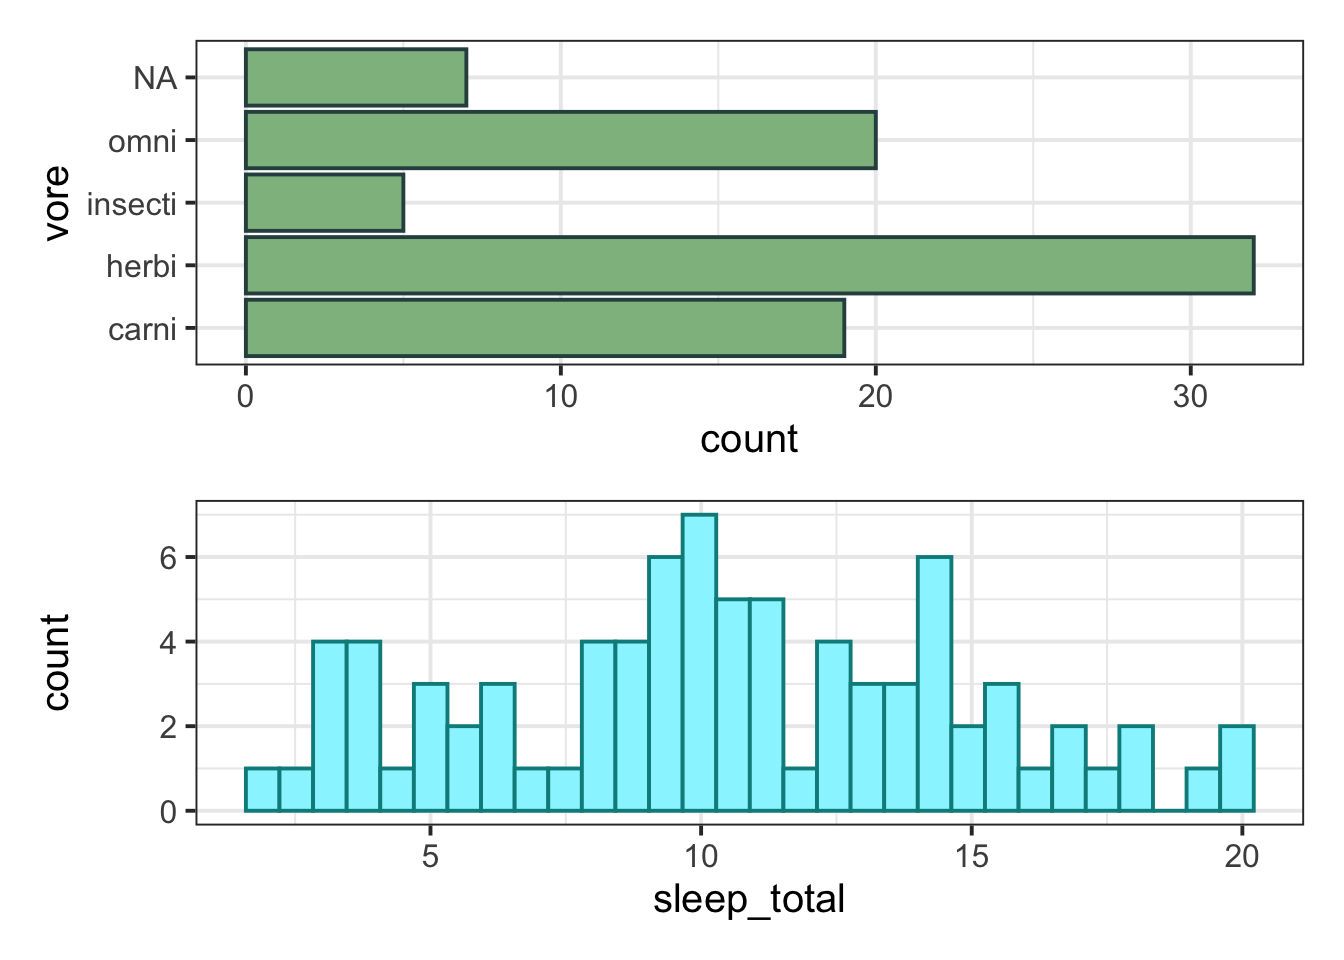
You can also write the two names with a / sign in between, and you’ll get one plot placed on top of the other:
# the first plot / the second plotplot_vorebar / plot_sleephist
(If patchwork is not loaded, you’ll get an error about bad use of arithmetic operator, because R won’t know how to handle the / sign.)
You can do a LOT more than this with patchwork, it is a very sophisticated tool! Check out the patchwork website for more.