| variable | description |
|---|---|
| age | Age of participant (years) |
| anx | Anxiety measure (z-scored) |
| strategy | Pre-test calming strategy (CloseEyes, Cough, DeepBreath) |
| hr | Average heart rate (in bpm, beats per minute) during test |
07: Sum coding
This week, you’ll run an analysis using a three-level sum-coded categorical predictor, while also controlling for a continuous numeric covariate.
NoteGet set up
- Open RStudio.
- Create a new .Rmd file for this week’s exercises.
- Save it somewhere you can find it again.
- Give it a clear name (for example,
dapr2_lab07.Rmd). - In the first code chunk, load the packages you’ll need this week (and install them if you don’t have them already):
tidyverse
RQ: Controlling for people’s pre-existing anxiety levels, is coughing before a lie detector test significantly associated with a lower-than-average heart rate during the test? (Apparently coughing is a way to immediately lower heart rate!)
Data dictionary:
NoteMore detail about this dataset
Law enforcement in some countries regularly rely on ‘polygraph’ tests as a form of ‘lie detection’. These tests involve measuring heart rate, blood pressure, respiratory rate and sweat. However, there is very little evidence to suggest that these methods are remotely accurate in being able to determine whether or not someone is lying.
Researchers are interested in if peoples’ heart rates during polygraph tests can be influenced by various pre-test strategies, including deep breathing, or closing their eyes. They recruited 142 participants (ages 22 to 64). Participants were told they were playing a game in which their task was to deceive the lie detector test, and they would receive financial rewards if they managed successfully. At the outset of the study, they completed a questionnaire which asked about their anxiety in relation to taking part. Participants then chose one of three strategies to prepare themselves for the test, each lasting one minute. These were “deep breathing”, “close your eyes”, or “cough”. Then the average heart rate of each participant was recorded during their lie detector test.
Set up and plot data
Question 1
Read in the data from https://uoepsy.github.io/data/polygraph.csv and store it in a variable named heartrate.
Question 2
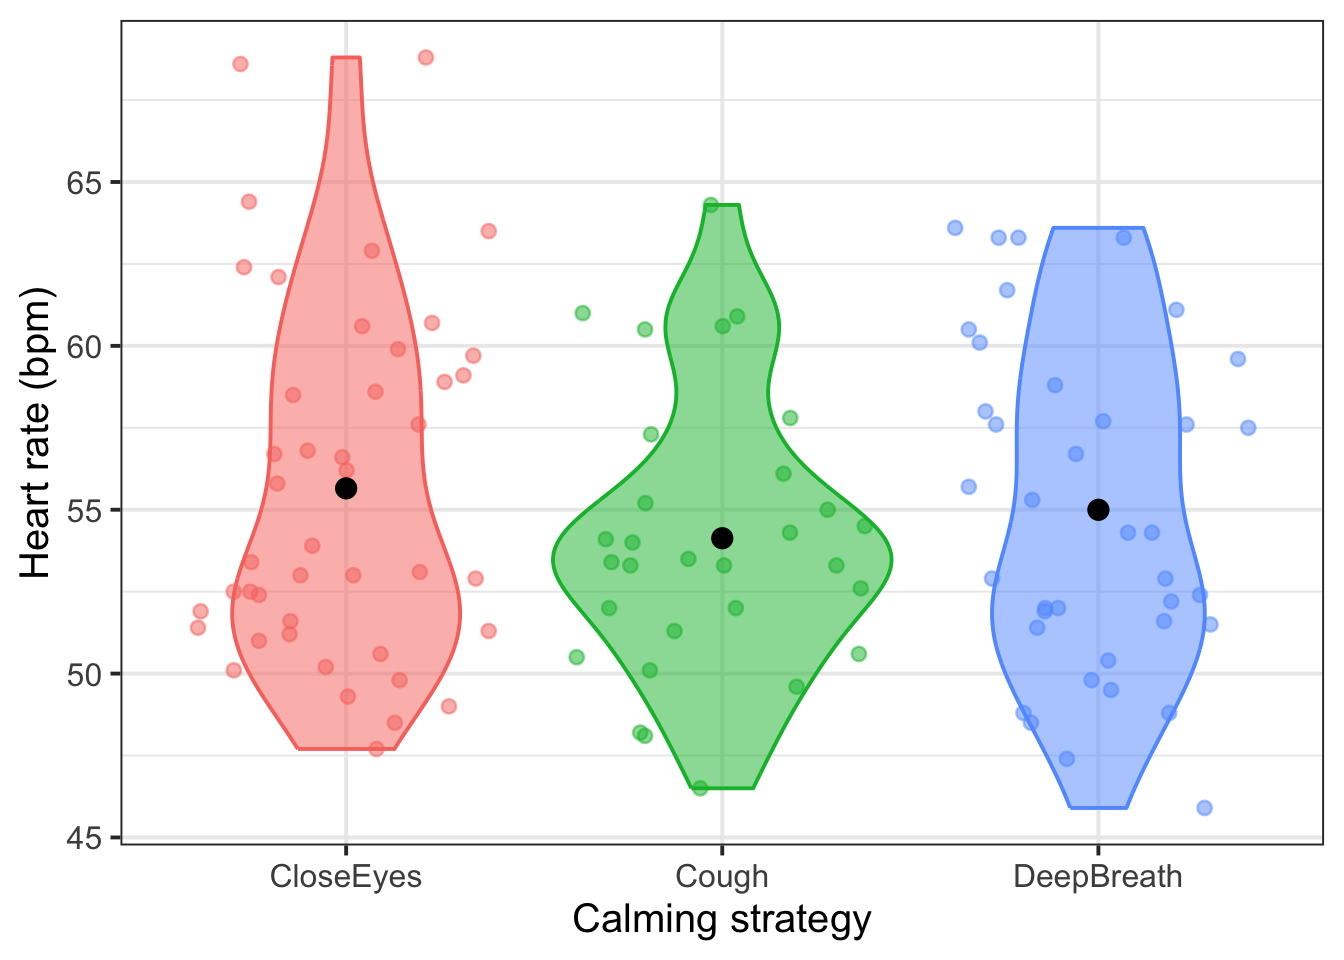
Make a violin plot (including jittered points and group means) to show the distribution of heart rate hr values for each pre-test calming strategy.
🗂️ See Exploring data visually > Violin plot flash card.
Set up sum coding
Question 3
First, convert strategy into a factor (don’t worry about ordering levels of the factor).
TipCode hint
For a dataframe df with a column called variable, the following code will take that column and change it into a factor.
df <- df |>
  mutate(
    variable = factor(variable)
  )
Then, run the following code to show the default contrast matrix that R would use if we used strategy as a predictor right now:
contrasts(heartrate$strategy)Write down: What contrast coding scheme does this contrast matrix represent?
Question 4
Apply sum coding to the strategy variable using the function contr.sum().
🗂️ See Sum coding > Define sum coding flash card.
After using contr.sum(), copy and run the following code to give the dummy variables—the columns of the contrast matrix—more useful names that tell you which level is coded as 1 in each variable. You don’t need to know what all the bits of this code mean (unless you want to!).
dimnames(contrasts(heartrate$strategy))[[2]] <- c('CloseEyes', 'Cough')Finally, generate the contrast matrix for strategy again. Verify that it looks the way you’d expect: do the column names match up with the values labelled 1 in each dummy variable?
Think ahead to model interpretation
Question 5
This is a conceptual/interpretation question—no coding needed.
The model we fit later will have two coefficients which correspond to the strategy variable: strategyCloseEyes and strategyCough. (We know this because there are two columns in the contrast matrix we generated above, and two columns \(\rightarrow\) two dummy variables \(\rightarrow\) two coefficients.)
For each of these two sum-coded slope coefficients, write a brief sentence that describes what each coefficient will mean/represent.
Decide: Which one of those coefficients will help you address the research question?
🗂️ See Sum coding > Model fit and interpretation flash card.
Question 6
This is a conceptual/interpretation question—no coding needed.
The RQ specifies that we must control for people’s pre-existing anxiety levels, which are contained in the continuous numeric variable anx. Therefore, we’ll include anx as a predictor in our model, and we’ll get a coefficient estimate for anx.
Think back to Block 1 and write a brief sentence about what the anx coefficient will mean/represent.
🗂️ See Multiple regression flash card.
Question 7
Write out the mathematical formulation of the model we will fit.
Hint: Your model should have three predictors. You can revisit the last couple questions to identify what the predictors should be.
🗂️ See Sum coding > Mathematical model formulation flash card.
Fit and interpret the model
Question 8
Fit this linear model in R and name it hr_mdl.
Display the model summary.
🗂️ See Sum coding > Model fit and interpretation flash card.
Question 9
This is a conceptual/interpretation question—no coding needed.
Write a sentence for each coefficient estimated by the model to interpret/explain what it means.
Bonus: Try to describe in your own words why the intercept means something different for treatment coding and for sum coding.
🗂️ See Sum coding > Model fit and interpretation flash card.
Then, write one sentence that answers the RQ.
Bonus: in the RQ sentence, report the relevant coefficient using APA formatting.
🗂️ See Resources > APA formatting for regression coefficients flash card.
Choosing coding schemes for different RQs
Question 10
This is a conceptual/interpretation question—no coding needed.
When you want to use a categorical predictor, you need to choose between treatment coding or sum coding. How do you choose? Based on which coding scheme will let you address your specific RQ best.
Here are five RQs. Based on the phrasing of each one, write down which contrast coding scheme you would use, and also explain why you chose that one. And if you choose treatment coding, also write down your choice of reference level.
- Do schoolchildren learn better when their classroom contains natural light compared to artificial light?
- What kind of background sound is associated with people spending more money in restaurants: no music, pop music, or classical music?
- Is life satisfaction in London lower than the average life satisfaction across UK cities?
- Do students in Psychology spend more time studying compared to the average study time across Philosophy, Psychology, and LEL?
- In a Stroop task, do neurotypical people perform worse than autistic people?
Optional: Knit your report to PDF
Note: During the labs, please spend your time on the exercises above, not on rendering your document. This guidance is here in case you have extra time at the end.
Rmarkdown is a useful format because it can be used as a foundation for generating different kinds of documents. For the group report, you’ll be asked to render your Rmd file to PDF. Why not practice now?
First, make sure you have tinytex installed in R. This is what lets you convert things into PDF format.
Run the following code to install tinytex (you’ll only need to run it once).
install.packages("tinytex")
tinytex::install_tinytex()
Then ensure that the “yaml” (rhymes with “mammal”) header—the bit at the top of your Rmd document—looks something like this:
---
title: "this is my report title"
author: "B1234506"
date: "07/09/2025"
output: bookdown::pdf_document2
---
Then follow the instructions from the Rmd bootcamp to knit your Rmd document to PDF.
If you encounter errors, refer to the DAPR1 formatting resources / knitting checklist.
TipWhat to do if you cannot knit to PDF
If you are having issues knitting directly to PDF, try the following:
- Knit to HTML file
- Open your HTML in a web-browser (e.g. Chrome, Firefox)
- Print to PDF (Ctrl+P, then choose to save to PDF)
- Open file to check formatting
TipHiding code and/or output from code chunks
Review Lesson 5 of the rmd bootcamp for a detailed description/worked examples.
Hiding R Code
To not show the code of an R code chunk, and only show the output, write:
```{r, echo=FALSE}
# code goes here
```
Hiding R Output:
To show the code of an R code chunk, but hide the output, write:
```{r, results='hide'}
# code goes here
```
Hiding R code AND output
To hide both code and output of an R code chunk, write:
```{r, include=FALSE}
# code goes here
```