Pre-requisites to enable referencing
To enable cross referencing of plots, figures and tables, we need to change the output of our document slightly.
We’re going to need to change the yaml:
Figure 1: The bit between three dashes is the YAML, and contains metadata about the document
Rather than using output: html_document or output: pdf_document, we are going to need to use some specific classes of output. The easy ones to start with are in the bookdown package.
Install the bookdown package and then change your output type to either bookdown::html_document2 or bookdown::pdf_document2. This will allow us to do the various referencing of Figures and Tables detailed below.
---
title: "this is my title"
author: "I am the author"
date: "13/08/2021"
output: bookdown::html_document2
---
Chunk names!
We reference a figure or table based on the code-chunk in which it is produced. For example, once we provide a name for the code-chunk below (“penguinplot”) we can then reference in text the Figure which has been produced by that chunk, and the numbering will be automatically sorted for us!
 ```{r penguinplot, fig.cap=“Counts of penguins of different species”}
 library(palmerpenguins)
 barplot(table(penguins$species))
 ```
Referencing a figure
To reference a figure, we use the format \@ref(fig:chunkname), where chunkname is the name of the code-chunk that outputs our figure. You can find an example below.
Write this:
As you can see in Figure \@ref(fig:penguinplot), there are various penguins of different species ```{r penguinplot, fig.cap=“Counts of penguins of different species”}
library(palmerpenguins)
barplot(table(penguins$species))
```
Compiles to this:
As you can see in Figure 2, there are various penguins of different species
library(palmerpenguins)
barplot(table(penguins$species))
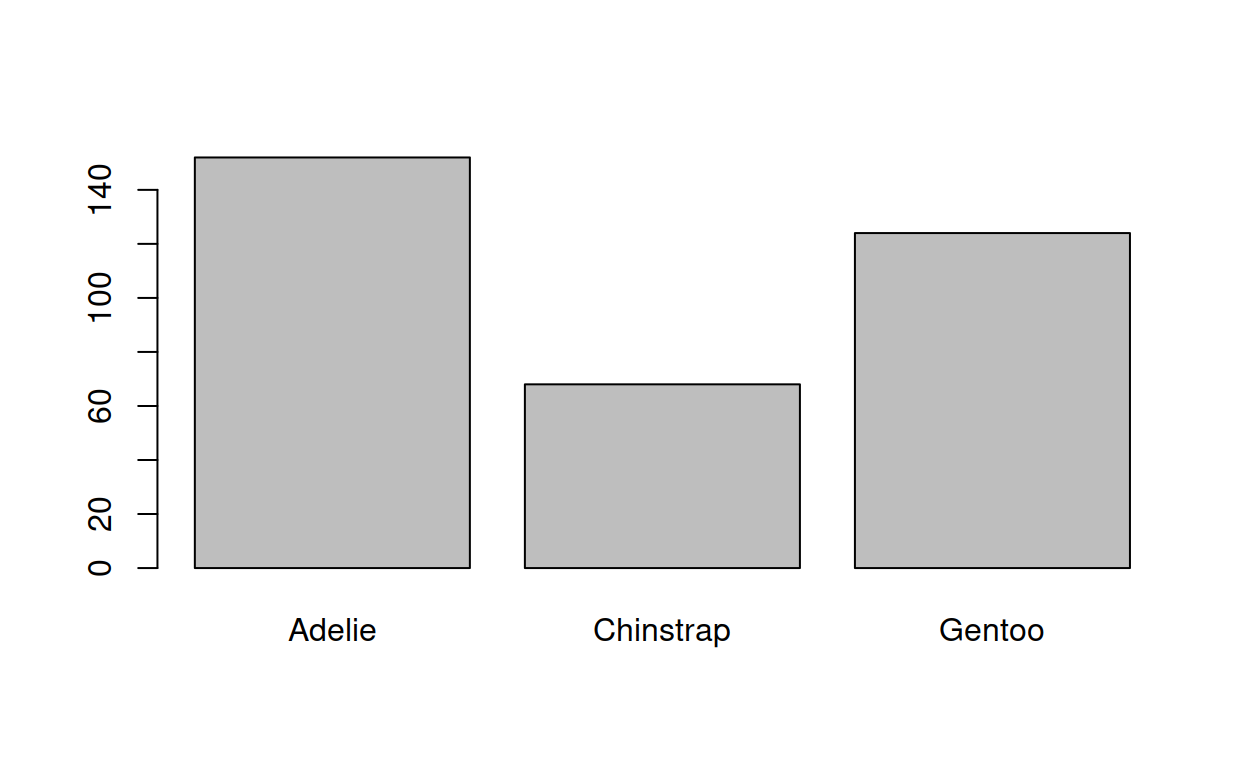
Figure 2: Counts of penguins of different species
Referencing a table
To reference a table, we use the format \@ref(tab:chunkname), where chunkname is the name of the code-chunk that outputs our table. You can find an example below.
Write this:
As you can see in Table \@ref(tab:penguinplot), there are various penguins of different species ```{r penguintable}
library(palmerpenguins)
knitr::kable(table(penguins$species), caption = “counts of penguins of different species”)
```
Compiles to this:
As you can see in Table 1, there are various penguins of different species
library(palmerpenguins)
knitr::kable(table(penguins$species), caption = "counts of penguins of different species")
| Var1 | Freq |
|---|---|
| Adelie | 152 |
| Chinstrap | 68 |
| Gentoo | 124 |
Figures & Tables Side by Side
This also works when arranging figures and tables side-by-side. For instance:
Writing this:
Oh look! A lovely plot can be found in figure \@ref(fig:thisismyplot). And a lovely table in Table \@ref(tab:thisismytable).
<div style=“display: inline-block; max-width: 45%; vertical-align: top;”>
 ```{r thisismytable, echo = FALSE}
 library(knitr)
 pass_scores <- read.csv(“https://edin.ac/2wJgYwL”)
 kable(table(pass_scores$school), caption=“Oh Look! A table!”)
 ```
</div>
<div style=“display: inline-block; max-width: 45%; vertical-align: top;”>
 ```{r thisismyplot, echo = FALSE, fig.cap=“It’s a plot!”}
 barplot(table(pass_scores$school))
 ```
</div>
Will compile to this:
Oh look! A lovely plot can be found in figure 3. And a lovely table in Table 2.
| Var1 | Freq |
|---|---|
| ECA | 3 |
| Economics | 2 |
| GeoSciences | 1 |
| LAW | 6 |
| PPLS | 5 |
| SLLC | 1 |
| SSPS | 2 |
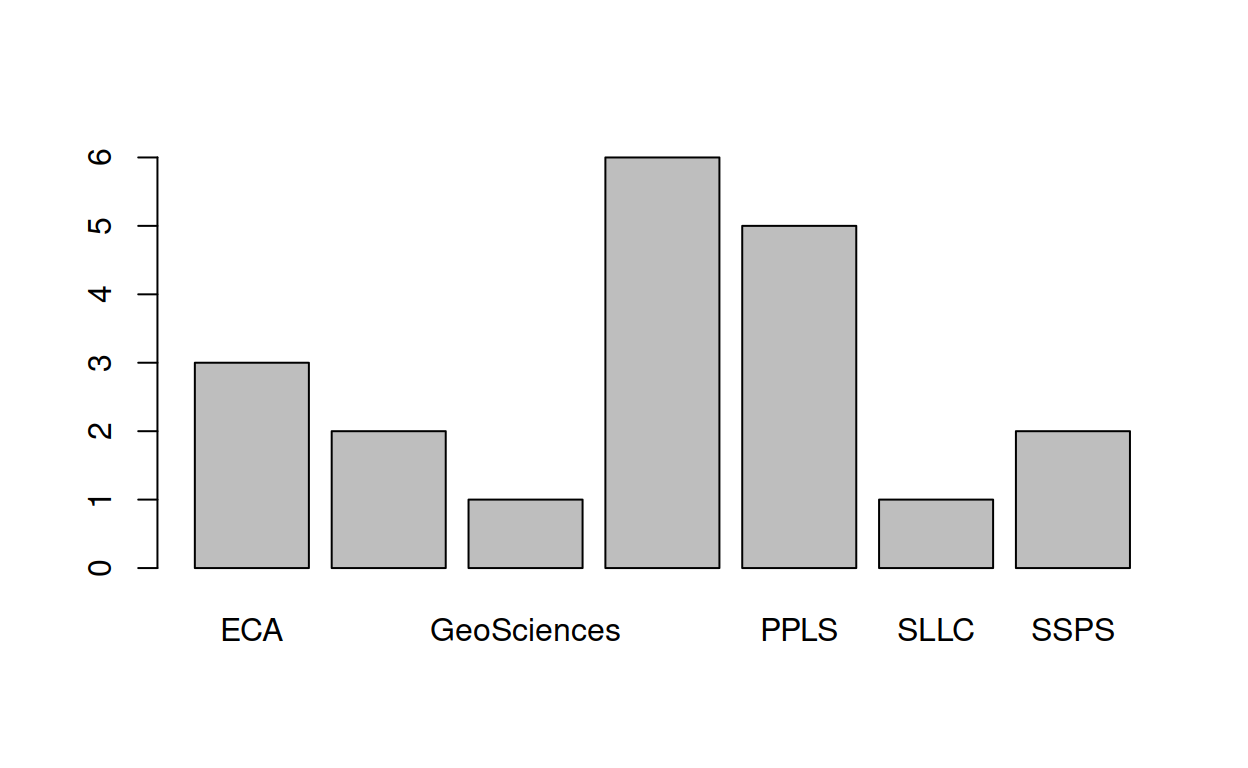
Figure 3: This is a plot!