Plots vs External image files
We have already seen how we can include a plot in a document, by creating the plot in a code-chunk:

However, we can also include images from files stored locally on our computer, or stored on the internet. We can do so using the include_graphics() function from the knitr package:
 ```{r}
 library(knitr)
 include_graphics(“https://edin.ac/37Ml3Q2”)
 include_graphics(“images/dougal.jpeg”)
 ```
library(knitr)
include_graphics("https://edin.ac/37Ml3Q2")
include_graphics("images/dougal.jpeg")
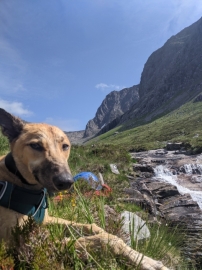
Figure options
We can use a lot of extra options to control the output of plots and figures. These are set as code-chunk options (see the Lesson on hiding code and output). A couple of the main ones are detailed below
width and height
Resize Any Image
To simply scale up/down any image at all, we can use the out.width and out.height options to set the height and width. Personally, I find it easiest to use these with pixels as the units:
Writing this:
 ```{r out.width=“150px”}
 include_graphics(“https://edin.ac/37Ml3Q2”)
 barplot(table(pass_scores$school))
 ```
Compiles to this:

Writing this:
 ```{r out.width=“300px”, out.height = “50px”}
 include_graphics(“https://edin.ac/37Ml3Q2”)
 barplot(table(pass_scores$school))
 ```
Compiles to this:

Resizing R-Generated Images Only
R-generated plots can also be resized using fig.width and fig.height. The defaults are 7x5. Note that this method of resizing adjusts the plotting area but preserves things such as font sizes, rather than simply resizing everything and losing resolution.
Writing this:
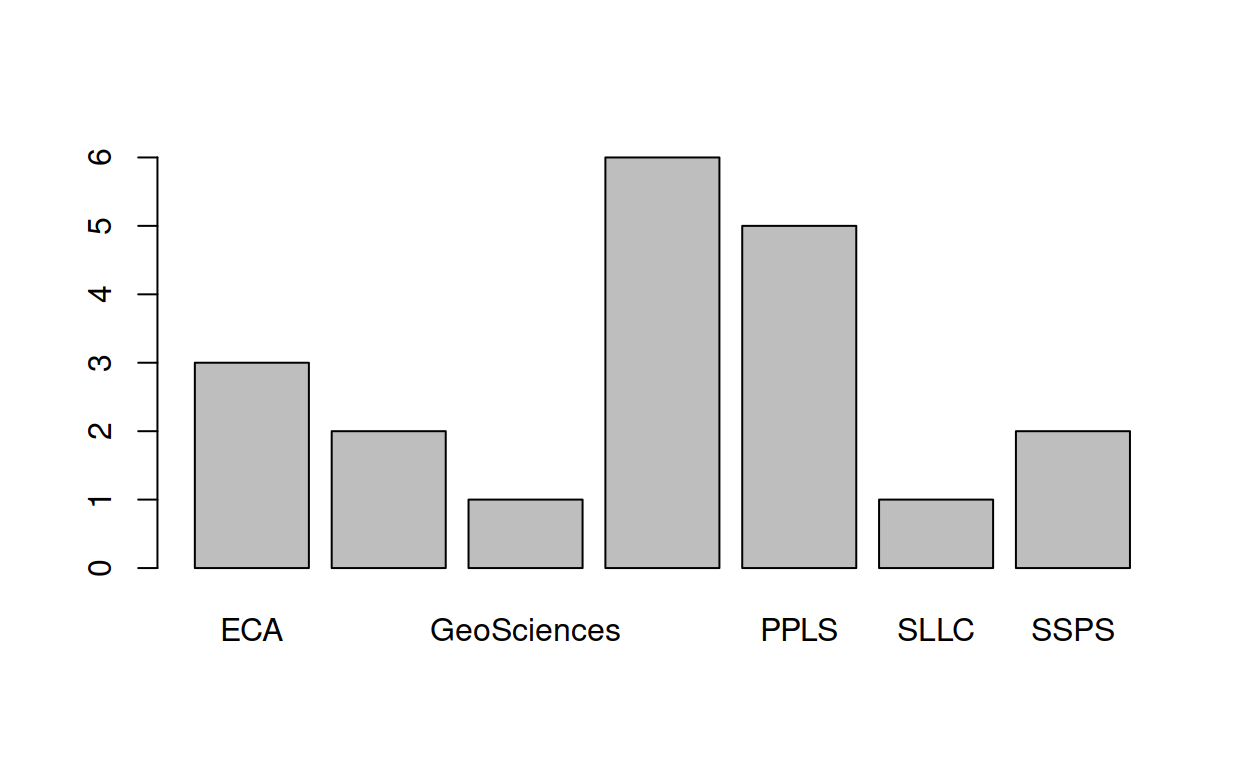
 ```{r}
 barplot(table(pass_scores$school))
 ```
Compiles to this:

Writing this:
 ```{r fig.width=3, fig.height=6}
 barplot(table(pass_scores$school))
 ```
Compiles to this:
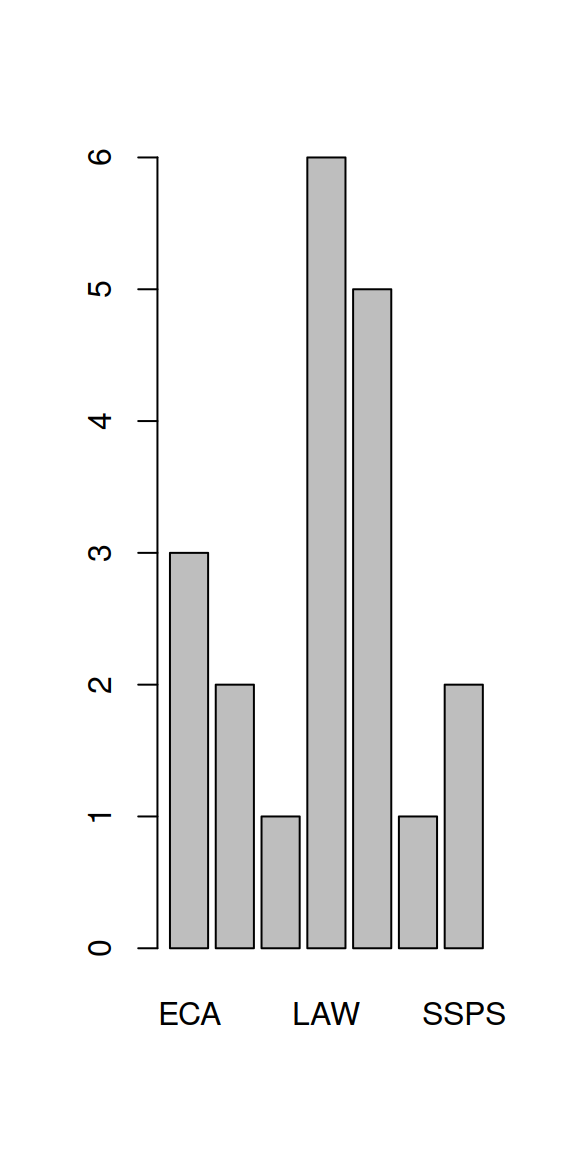
fig.align
This one should be fairly intuitive: do you want your image on the left, middle or right?
 ```{r fig.align=“left”}
 include_graphics(“https://edin.ac/37Ml3Q2”)
 ```
library(knitr)
include_graphics("https://edin.ac/37Ml3Q2")
 ```{r fig.align=“center”}
 include_graphics(“https://edin.ac/37Ml3Q2”)
 ```
library(knitr)
include_graphics("https://edin.ac/37Ml3Q2")
 ```{r fig.align=“right”}
 include_graphics(“https://edin.ac/37Ml3Q2”)
 ```
library(knitr)
include_graphics("https://edin.ac/37Ml3Q2")
Captions
We can include captions for an image or a plot by using the fig.cap option. Note that this needs a separate code-chunk if you want different captions for each image.
Writing this:
 ```{r fig.cap=“Counts of penguins of different species”}
 library(palmerpenguins)
 barplot(table(penguins$species))
 ```
 ```{r fig.cap=“a picture of a brain…”}
 include_graphics(“https://edin.ac/37Ml3Q2”)
 ```
Compiles to this:
library(palmerpenguins)
barplot(table(penguins$species))
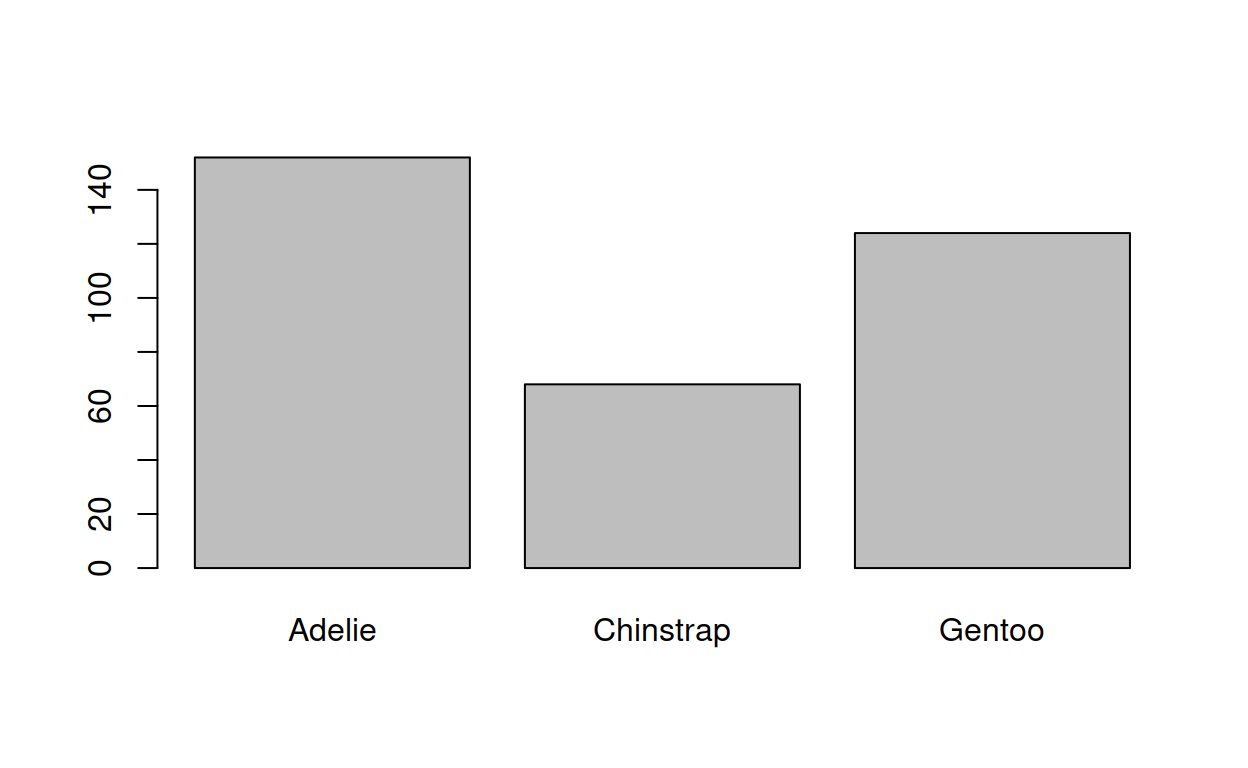
Figure 1: Counts of penguins of different species
include_graphics("https://edin.ac/37Ml3Q2")
Figure 2: a picture of a brain…
Multiple Figures
For arranging multiple plots created in GGplot, please see the patchwork package. It allows you to combine plots in various different ways.
Figures & Tables
Arranging figures and tables side-by-side in RMarkdown can be a bit of a pain. The easiest way (only when compiling to .html) is to include write some quick html code.
Writing this:
<div style=“display: inline-block; max-width: 45%; vertical-align: top;”>
 ```{r mychunkname, echo = FALSE}
 library(knitr)
 pass_scores <- read.csv(“https://edin.ac/2wJgYwL”)
 kable(table(pass_scores$school))
 ```
</div>
<div style=“display: inline-block; max-width: 45%; vertical-align: top;”>
 ```{r mychunkname2, echo = FALSE}
 barplot(table(pass_scores$school))
 ```
</div>
Will compile to this:
| Var1 | Freq |
|---|---|
| ECA | 3 |
| Economics | 2 |
| GeoSciences | 1 |
| LAW | 6 |
| PPLS | 5 |
| SLLC | 1 |
| SSPS | 2 |