To describe and predict how variables are associated, a key mathematical tool is the function.
A function is a mathematical expression that
takes some value as input,
transforms that input in some specified way, and
returns a single value as output.
In DAPR2, we focus on linear functions, which have the form \(y = c + mx\).
\(y\): outcome variable, dependent variable
\(c\): y-intercept (where the line intersects the y-axis, or the value of the function when \(x = 0\))
\(m\): the slope of the line
\(x\): input variable, independent variable
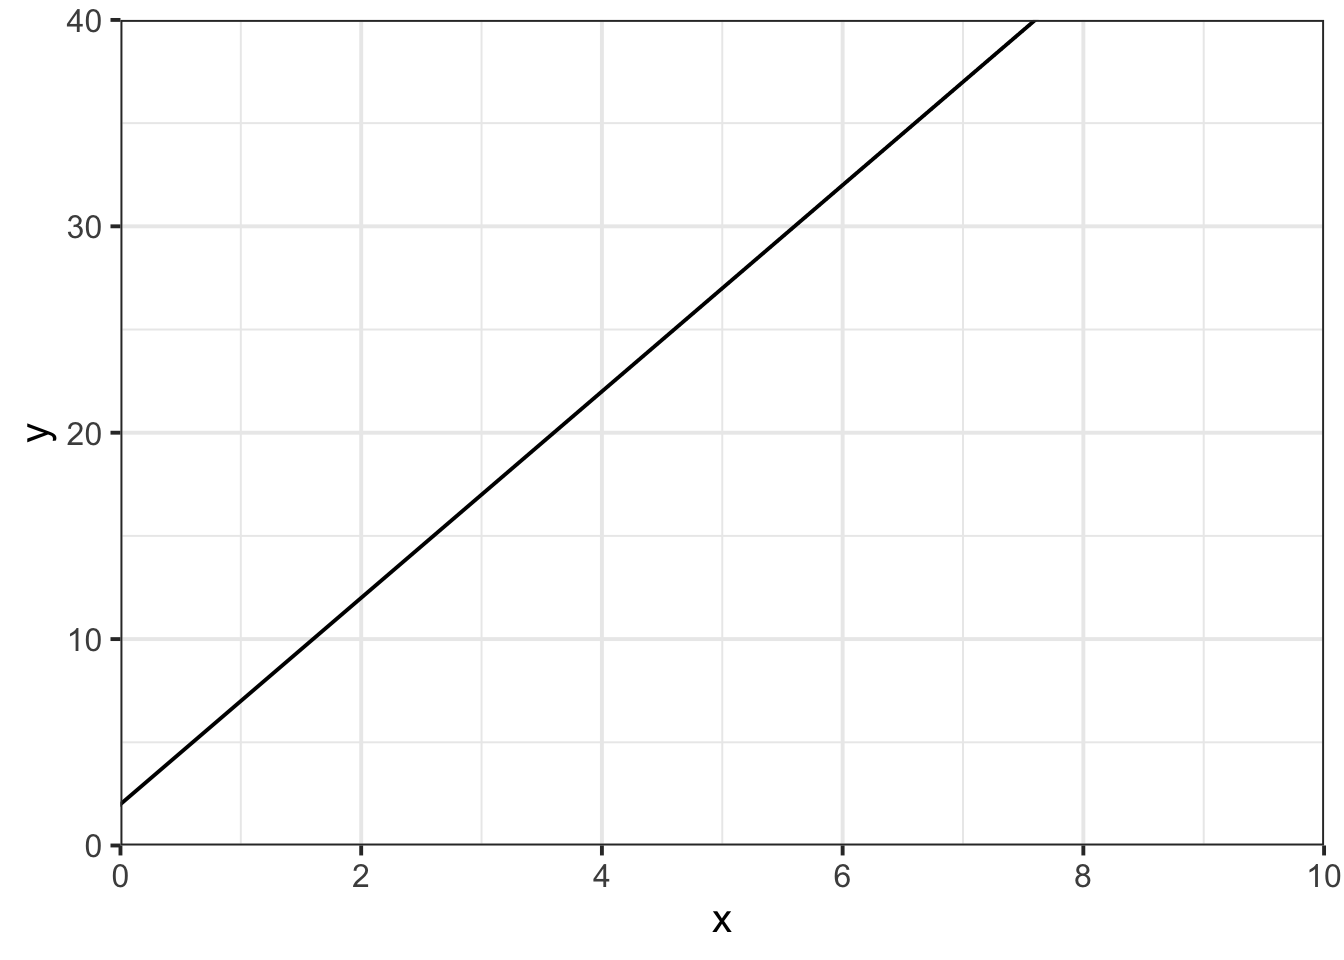
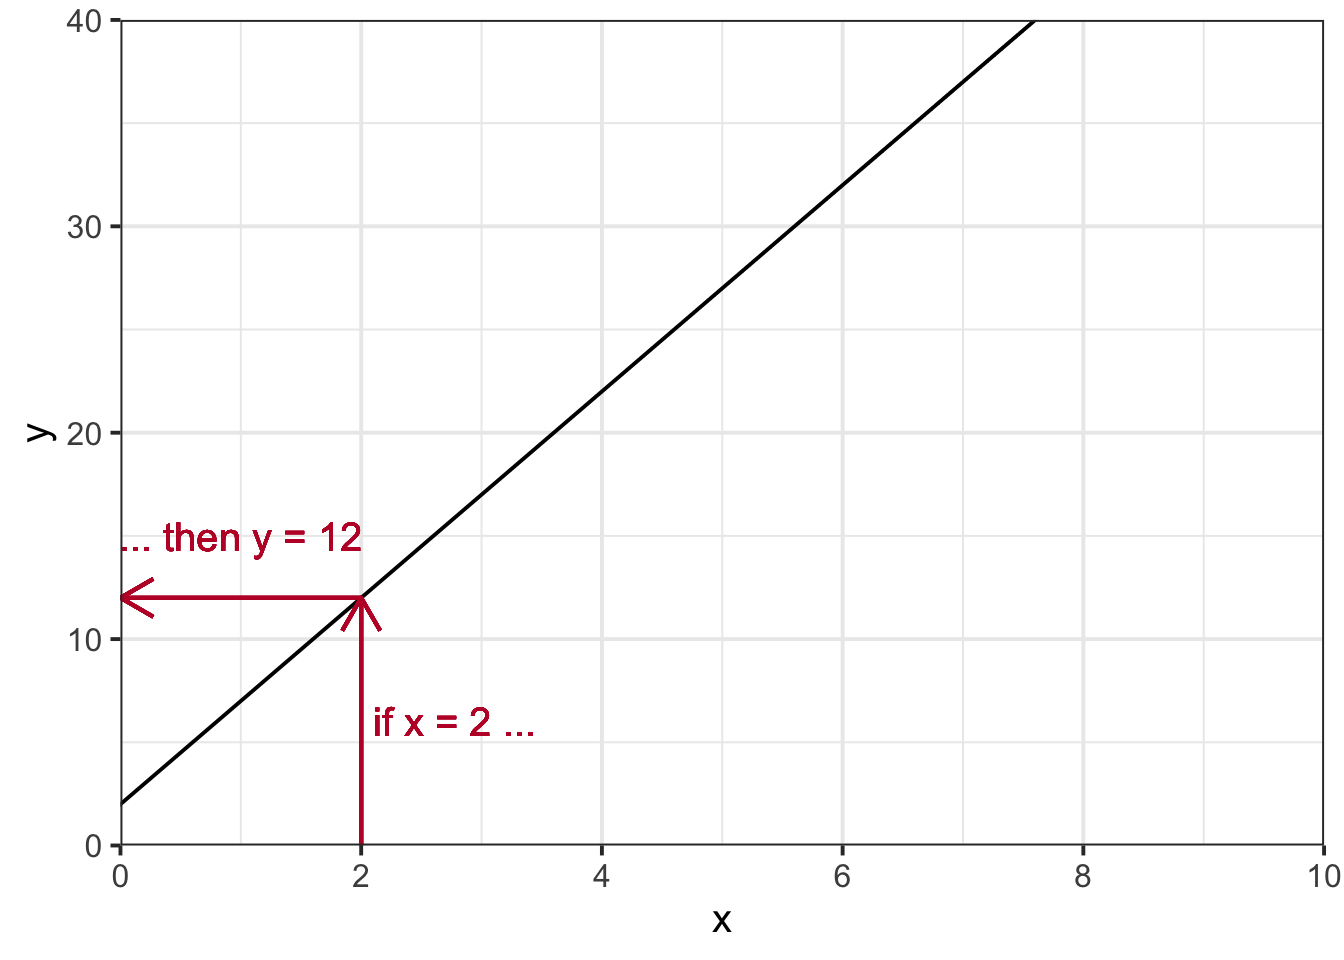
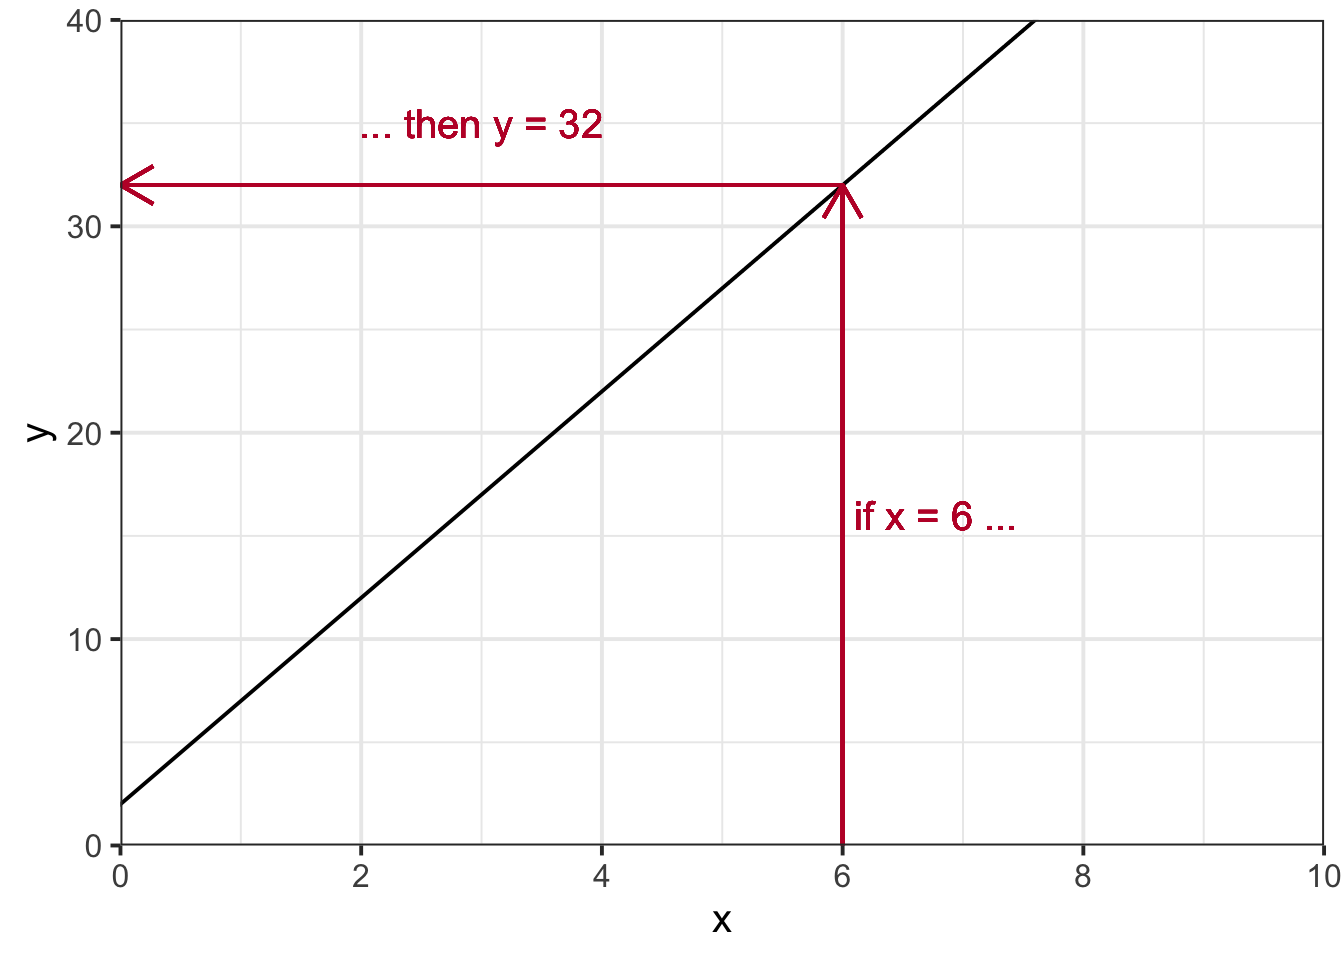
Take, for example, the function \(y = 2 + 5x\). This function describes a line with a slope of 5 and a y-intercept (in stats we just call it an “intercept”) of 2. That function looks like this:
p_line +# arrow from x to linegeom_segment(x =6, xend =6, y =0, yend =32, colour = dapr2red, arrow =arrow(length =unit(0.5,"cm"))) +geom_text(x =6+0.1, y =16, label ='if x = 6 ...', colour = dapr2red, hjust =0) +# arrow from line to ygeom_segment(x =6, xend =0, y =32, yend =32, colour = dapr2red, arrow =arrow(length =unit(0.5,"cm"))) +geom_text(x =3, y =32+3, label ='... then y = 32', colour = dapr2red, hjust =0.5) +NULL
Because you always get the same output every time you give the function the same input, a linear function like this is an example of a deterministic function.