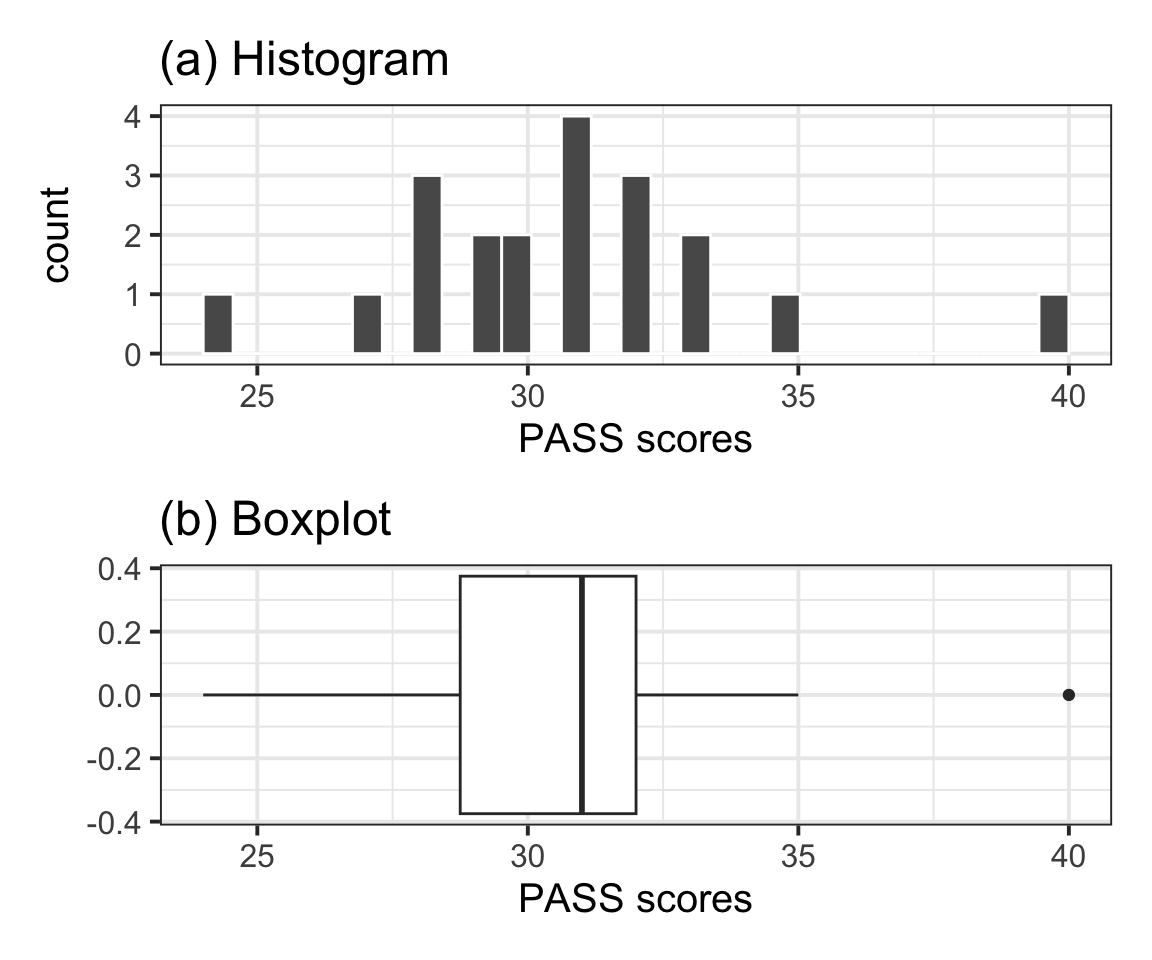
The distribution of PASS scores, as shown in Figure 1(a), is roughly bell shaped and does not have any impossible values. The outlier (40) depicted in the boxplot shown in Figure 1(b) is well within the range of plausible values for the PASS scale (0–90) and as such was not removed for the analysis.
Table 1 displays summary statistics for the PASS scores in the sample of Edinburgh University students. From the sample data we obtain an average procrastination score of \(M = 30.7\), 95% CI [29.15, 32.25]. Hence, we are 95% confident that a Edinburgh University student will have a procrastination score between 29.15 and 32.25, which is between 0.75 and 3.85 lower than the average score of 33 reported by Solomon & Rothblum.
Let \(\mu\) denote the mean PASS score of all Edinburgh University students. At the 5% significance level, we performed a one sample t-test of \(H_0 : \mu = 33\) against \(H_1 : \mu \neq 33\). The sample data provide very strong evidence against the null hypothesis and in favour of the alternative one that the mean procrastination score of Edinburgh University students is significantly different from the Solomon & Rothblum reported average of 33: \(t(19) = -3.11, p = .006\), two-sided.