Formatting resources
This page contains formatting resources that will help you finalise your report formatting prior to submission.
1 Successful knitting checklist
If you encounter errors when knitting the Rmd file, go through the following checklist to try finding the source of the errors.
2 APA style reporting
Check the following guide for reporting numbers and statistics in APA style (7th edition).
3 Hiding code and/or output
To not show the code of an R code chunk, and only show the output, write:
```{r, echo=FALSE}
# code goes here
```
To show the code of an R code chunk, but hide the output, write:
```{r, results='hide'}
# code goes here
```
To hide both text output and figures, use:
```{r, results='hide', fig.show='hide'}
# code goes here
```
To hide both code and output of an R code chunk, write:
```{r, include=FALSE}
# code goes here
```
4 Figures
4.1 Combining plots
You can combine multiple plots into a single figure using the functions | and / from library(patchwork).
Suppose you stored four plots into objects named plt1, plt2, plt3, plt4. To combine the four plots into a single figure with 2 rows and 2 columns, you can use:
(plt1 | plt2) / (plt3 | pl4)The vertical bar | places figures side by side. The forward slash / starts a new row.
4.2 Reducing figure size
You can adjust the figure height and width with the following code chunk options: fig.height = ?, fig.width = ?.
Trying different numbers by trial-and-error, substitute numbers where the ? are, and adjust as needed: for example, 5 and 4, 12 and 8, etc. Always keep in mind, that the figure labels should still be legible in your resulting plots.
```{r, fig.height = 5, fig.width = 4}
# your code to display the figure here
```
4.3 Referencing figures
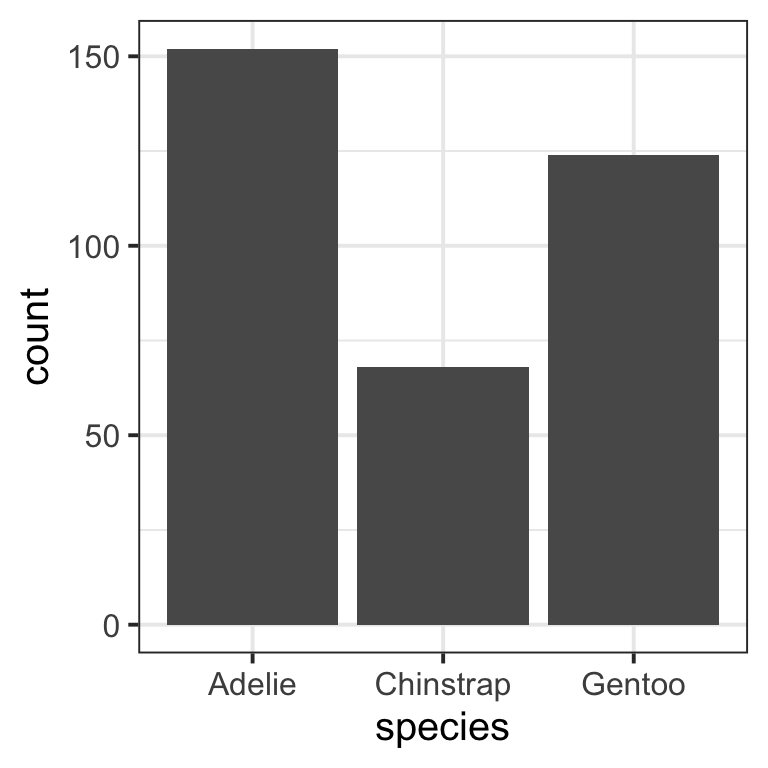
Step 1. Create a unique label for the code chunk that displays the figure, in this case UniqueFigureLabel but you should use a more descriptive name.
```{r UniqueFigureLabel, fig.cap = "Write a figure caption here"}
library(tidyverse)
library(palmerpenguins)   # for the penguins example data we are using here
pltSpecies <- ggplot(penguins, aes(x = species)) +
    geom_bar()
pltSpecies
```To reference a figure in the Rmd file, for example the one above, you would write:
Figure \@ref(fig:UniqueFigureLabel) displays...
which, when you Knit to PDF, becomes:
Figure 1 displays…
5 Tables
We will use example data from library(palmerpenguins) about the body_mass_g of different species of penguins.
5.1 Pretty PDF tables
Suppose you created a descriptives table and stored it into tbl:
library(tidyverse)
library(palmerpenguins)   # for the penguins example data we are using here

tbl <- penguins |>
    group_by(species) |>
    summarise(M = mean(body_mass_g, na.rm = TRUE),
              SD = sd(body_mass_g, na.rm = TRUE))
tbl
# A tibble: 3 × 3
species M SD
<fct> <dbl> <dbl>
1 Adelie 3701. 459.
2 Chinstrap 3733. 384.
3 Gentoo 5076. 504.It wouldn’t be appropriate to show this R printout in a paper/report/dissertation. Instead, you can create a properly formatted table for a PDF report using the kbl() or kable() functions from library(kableExtra).
```{r, echo=FALSE}
library(kableExtra)
tbl |>
    kbl(digits = 2, booktabs = TRUE,
        caption = "Write a table caption here")
```| species | M | SD |
|---|---|---|
| Adelie | 3700.66 | 458.57 |
| Chinstrap | 3733.09 | 384.34 |
| Gentoo | 5076.02 | 504.12 |
The provided options are:
-
digits = 2, to format numbers to only have 2 decimal places -
booktabs = TRUE, to create “book-style” tables, i.e. tables with horizontal rows only -
caption = "Write a table caption here", to provide a table caption
5.2 Referencing tables
This is a continuation of the previous example, where we created a descriptives table and stored it into tbl. Please note that tbl is not a kbl()/kable() yet.
To reference a table you need to pick a unique label for the code chunk that displays the table, in this case UniqueTableLabel but you should use a more descriptive name.
You must also ensure that the table has a caption for the referencing to work.
```{r UniqueTableLabel, echo=FALSE}
library(kableExtra)
tbl |>
    kbl(digits = 2, booktabs = TRUE,
        caption = "Write here a table caption")
```| species | M | SD |
|---|---|---|
| Adelie | 3700.66 | 458.57 |
| Chinstrap | 3733.09 | 384.34 |
| Gentoo | 5076.02 | 504.12 |
In the Rmd file, the table is referenced as:
Table \@ref(tab:UniqueTableLabel) displays...
which, when you knit to PDF, is displayed as:
Table 1 displays…
For details on styling PDF tables, see this link.