d3 <- read_csv("https://uoepsy.github.io/data/lmm_mindfuldecline.csv")Random Effect Structures & Model Building
Data Analysis for Psychology in R 3
Nested Structures
The things in a cluster belong only to that cluster.

Nested Structures (2)
The things in a cluster belong only to that cluster.
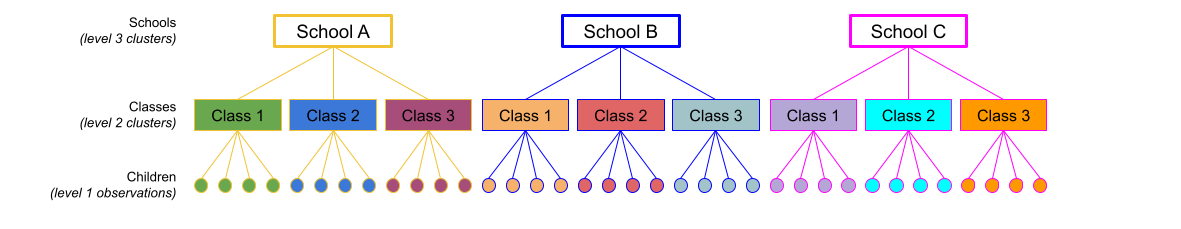

Nested Structures (3)
The things in a cluster belong only to that cluster.
(1 | school) + (1 | class:school)or
(1 | school) + (1 | school:class)
Nested Structures (4) - Labels!
The things in a cluster belong only to that cluster.
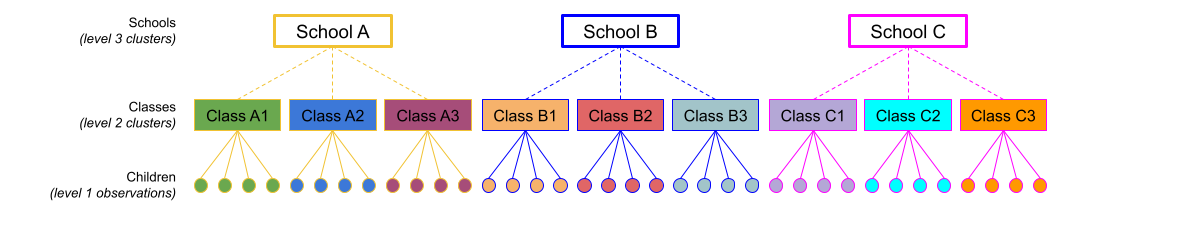

Nested Structures (5) - Labels!
The things in a cluster belong only to that cluster.
(1 | school) + (1 | class:school)or
(1 | school) + (1 | school:class)or
(1 | school) + (1 | class) iff the labels of classes are unique!!
Example 1 (just two levels)
One study site recruits 20 participants.
Each participant has 10 datapoints.
 sitename    ppt   condition visit age  ACE   imp
    Sncbk  PPT_1     control     1  60 84.5 unimp
    Sncbk  PPT_1     control     2  62 85.6   imp
    Sncbk  PPT_1     control     3  64 84.5   imp
    Sncbk  PPT_1     control     4  66 83.1   imp
      ...    ...         ...   ... ...  ...   ...
    Sncbk PPT_11 mindfulness     1  60 85.6   imp
    Sncbk PPT_11 mindfulness     2  62 84.5 unimp
    Sncbk PPT_11 mindfulness     3  64 85.7   imp
Sncbk PPT_11 mindfulness 4 66 84.8 unimpggplot(d3, aes(x=visit, y=ACE))+
geom_line(aes(group=ppt, col=condition), alpha=.7)+
theme(legend.position = "bottom")
... + (1 + ... | ppt)Example 2 (another level, nested)
14 study sites each recruit c20 participants.
Each participant has 10 datapoints.
d3full <- read_csv("https://uoepsy.github.io/data/lmm_mindfuldeclineFULL.csv") sitename ppt condition visit age ACE imp
Savdz PPT_1 control 1 60 84.8 imp
Savdz PPT_1 control 2 62 85 imp
Savdz PPT_1 control 3 64 83.9 imp
Savdz PPT_1 control 4 66 83 imp
Savdz PPT_1 control 5 68 82.2 imp
Savdz PPT_1 control 6 70 81.9 imp
... ... ... ... ... ... ...
... ... ... ... ... ... ...
Slonb PPT_8 control 9 76 82.1 imp
Slonb PPT_8 control 10 78 81.6 imp
Slonb PPT_9 mindfulness 1 60 85 imp
Slonb PPT_9 mindfulness 2 62 85.1 imp
... ... ... ... ... ... ...ggplot(d3full, aes(x=visit, y=ACE))+
geom_line(aes(group=ppt, col=condition), alpha=.7) +
facet_wrap(~sitename)+
theme(legend.position = "bottom")
... + (1 + ... | sitename) + (1 + ... | ppt:sitename)Crossed Structures
Things that are crossed == anything with multiple groups that are “not nested”

Crossed Structures (2)
Things that are crossed == anything with multiple groups that are “not nested”

Crossed Structures (3)
Things that are crossed == anything with multiple groups that are “not nested”

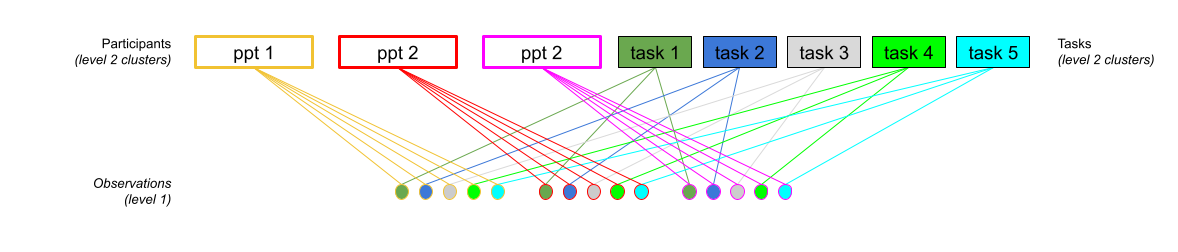
Crossed Structures (4)
Things that are crossed == anything with multiple groups that are “not nested”
(1 | subject) + (1 | task)
Example 3 (crossed)
Participants take part in an experiment where they each complete the same 10 tasks.
d3cross <- read_csv("https://uoepsy.github.io/data/lmm_egcross1.csv") ppt task score
ppt_01 task_01 7.4
ppt_01 task_02 3.4
... ... ...
ppt_01 task_06 5.3
ppt_01 task_07 6.7
... ... ...
... ... ...
ppt_02 task_01 16.2
ppt_02 task_02 12
... ... ...
ppt_02 task_06 13.8
ppt_02 task_07 14.9
... ... ...
... ... ...
ppt_11 task_01 12.2
ppt_11 task_02 7.7
... ... ...
ppt_11 task_06 9.8
ppt_11 task_07 11.2
... ... ...ggplot(d3cross,aes(x = 1, y = score)) +
geom_jitter(size=3,height=0,width=.2,alpha=.6)+
facet_wrap(~ppt) +
labs(title="participants")+
scale_x_continuous(limits=c(.5,1.5),breaks=NULL)
... + (1 + ... | participant) + ...Example 3 (crossed)
Participants take part in an experiment where they each complete the same 10 tasks.
d3cross <- read_csv("https://uoepsy.github.io/data/lmm_egcross1.csv") ppt task score
ppt_01 task_01 7.4
ppt_01 task_02 3.4
... ... ...
ppt_01 task_06 5.3
ppt_01 task_07 6.7
... ... ...
... ... ...
ppt_02 task_01 16.2
ppt_02 task_02 12
... ... ...
ppt_02 task_06 13.8
ppt_02 task_07 14.9
... ... ...
... ... ...
ppt_11 task_01 12.2
ppt_11 task_02 7.7
... ... ...
ppt_11 task_06 9.8
ppt_11 task_07 11.2
... ... ...ggplot(d3cross,aes(x = 1, y = score)) +
geom_jitter(size=3,height=0,width=.2,alpha=.6)+
facet_wrap(~task) +
labs(title="tasks")+
scale_x_continuous(limits=c(.5,1.5),breaks=NULL)
... + (1 + ... | task) + ...Example 3 (crossed)
Participants take part in an experiment where they each complete the same 10 tasks.
d3cross <- read_csv("https://uoepsy.github.io/data/lmm_egcross1.csv") ppt task score
ppt_01 task_01 7.4
ppt_01 task_02 3.4
... ... ...
ppt_01 task_06 5.3
ppt_01 task_07 6.7
... ... ...
... ... ...
ppt_02 task_01 16.2
ppt_02 task_02 12
... ... ...
ppt_02 task_06 13.8
ppt_02 task_07 14.9
... ... ...
... ... ...
ppt_11 task_01 12.2
ppt_11 task_02 7.7
... ... ...
ppt_11 task_06 9.8
ppt_11 task_07 11.2
... ... ...ggplot(d3cross,aes(x = 1, y = score, col = task)) +
geom_jitter(size=3,height=0,width=.2,alpha=.6)+
facet_wrap(~ppt) +
labs(title="participants and tasks")+
scale_x_continuous(limits=c(.5,1.5),breaks=NULL)+
scale_color_viridis_d(option = "C")
... + (1 + ... | participant) + (1 + ... | task)Example 1 (just two levels)

multiple observations from each participant
(1 | ppt)for a single ppt, the slope of
ACE ~ visitexists in our study design. This could (quite likely) be different for different ppts!
(visit | ppt)for a single ppt, the slope of
ACE ~ conditionis not observed in our study design (each ppt is either one condition or the other).
(condition | ppt)
lmer(ACE ~ 1 + visit * condition + ??? lmer(ACE ~ 1 + visit + condition +
(1 + visit | ppt), data)Example 2 (another level, nested)

multiple observations from each participant:
(1 | sitename)multiple participants nested within study sites:
(1 | sitename) + (1 | ppt:sitename)for a single ppt, the slope of
ACE ~ visitexists in our study design:
(visit | ppt)for a single study site, the slope of
ACE ~ visitexists in our study design:
(visit | sitename)for a single ppt, the slope of
ACE ~ conditiondoes not exist in our study design:
(condition | ppt)for a single study site, the slope of
ACE ~ conditionexists in our study design:
(condition | sitename)
lmer(ACE ~ 1 + visit * condition + ??? lmer(ACE ~ 1 + visit * condition +
(1 + visit * condition | sitename ) +
(1 + visit | ppt:sitename), data)Example 3 (crossed)
Participants take part in an experiment where they each complete 10 tasks. Odd numbered participants are in Group 1, Even numbered participants in Group 2. Participants see tasks 1-5 in Condition A and tasks 6-10 in B.

multiple observations from each participants:
(1 | ppt)participants are observed in each condition - the effect of condition could be different for participant 1 vs participant 2
(condition | ppt)participants are observed in either group 1 or group 2. The effect of group is not defined for a single participant:
(group | ppt)
lmer(score ~ condition * group + ??? Example 3 (crossed)
Participants take part in an experiment where they each complete 10 tasks. Odd numbered participants are in Group 1, Even numbered participants in Group 2. Participants see tasks 1-5 in Condition A and tasks 6-10 in B.

multiple observations from each participants:
(1 | ppt)participants are observed in each condition - the effect of condition could be different for participant 1 vs participant 2
(condition | ppt)participants are observed in either group 1 or group 2. The effect of group is not defined for a single participant:
(group | ppt)multiple observations of each task (not nested within ppts):
(1 | task)
tasks are completed by people in each group - the effect of group could be different for task 1 vs task 2:
(group | task)tasks 1-5 are in Condition A, and 6-10 in Condition B. The effect of condition isn’t defined for any given task:
(condition | task)
lmer(score ~ condition * group + ??? lmer(score ~ condition * group +
(1 + condition | ppt ) +
(1 + group | task), data = dfcross)Example 4 (crossed, but more complex!)
Participants take part in an experiment where they each complete 10 tasks. Odd numbered participants are in Group 1, Even numbered participants in Group 2. Participants 1-10 see tasks 1-5 in Condition A and tasks 6-10 in B, Participants 11-20 see tasks 1-5 in B and 6-10 in A.

multiple observations from each participants:
(1 | ppt)participants are observed in each condition - the effect of condition could be different for participant 1 vs participant 2
(condition | ppt)participants are observed in either group 1 or group 2. The effect of group is not defined for a single participant:
(group | ppt)multiple observations of each task (not nested within ppts):
(1 | task)
tasks are completed by people in each group - the effect of group could be different for task 1 vs task 2:
(group | task)tasks in each condition are completed by both groups. How group effects interact with condition effects could be different for task 1 vs 2:
(group * condition | task)
lmer(score ~ condition * group + ??? lmer(score ~ condition * group +
(1 + condition | ppt ) +
(1 + condition * group | task), data = dfcross)The poke in the eye
Sometimes a model is too complex to be supported by the data
Balancing act between simplifying our model while preserving attribution of variance to various sources
Convergence Warnings:
warning(s): Model failed to converge with max|grad| = 0.041777 (tol = 0.002, component 1) (and others)
Singular Fits:
message(s): boundary (singular) fit: see help('isSingular')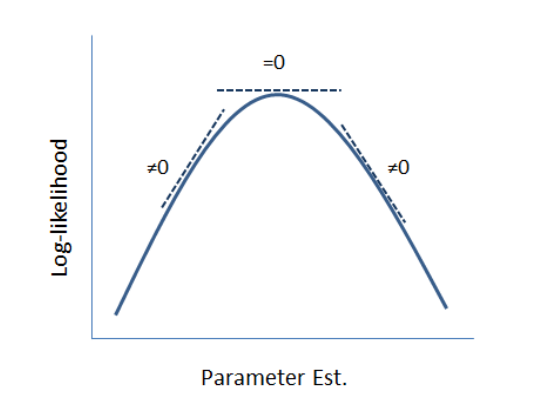
how to simplify (4)
removing correlations between random effects
mod <- lmer(y ~ 1 + x * b +
              (1 + x | group), data = cordat)
VarCorr(mod)
Groups Name Std.Dev. Corr
group (Intercept) 0.199
x 0.342 1.00
Residual 0.216 plot(ranef(mod)$g)
modzc <- lmer(y ~ 1 + x * b +
              (1 + x || group), data = cordat)
VarCorr(modzc)
Groups Name Std.Dev.
group (Intercept) 0.186
group.1 x 0.352
Residual 0.221 plot(ranef(modzc)$g)
This week
Tasks
 Complete readings
 Attend your lab and work together on the exercises
 Complete the weekly quiz
Support
 Piazza forum!
 Office hours (see Learn page for details)