

Bootstrapping and
confidence intervals
Data Analysis for Psychology in R 2
What’s a bootstrap?

What do bootstraps have to do with stats?
Unclear.
We’ll revisit this question later once we’ve seen the method in action.
Bootstrapping: Resampling from a sample

Generate bootstrapped samples by sampling with replacement
Imagine our main sample contains five shapes:


If we could only sample each data point once:
Each sample is just a shuffled version of the original.
If we could sample each data point repeatedly:
Each sample is distinct!
To create diverse samples, we need to be able to sample each data point repeatedly.
This is called “sampling with replacement”.
Activity: Bootstrapping our own samples
Population: All numbers from 1 to 100.
Main sample (size 10):
6 8 17 32 70 76 79 81 85 93
Bootstrapped samples (size 10): Over to you!
What just happened?
Which model assumptions are not met?

 Linearity?
Independent errors?
Normally-distributed errors?
Equal variance of errors?
Check: Linearity
Use geom_smooth() to plot a straight line (method = 'lm') and a curvy line (method = 'loess'). The curvy line should match the straight line.

Not perfect, but relatively good.
Check: Normally-distributed errors
With a Q-Q plot, compare the actual standardised residuals from the model (y axis) to the ones we’d expect, if errors were perfectly normally distributed (x axis).

Big divergences toward the extremes: there are more large residuals in our data than a normal distribution would have.
Check: Equal variance of errors
With a plot of residuals vs. fitted values, check whether the residuals (y axis) are similar across all of the fitted/predicted values (x axis).

There’s a definite cone-shape here (ideally we’d want a random-looking cloud), so residuals do not have equal variance.
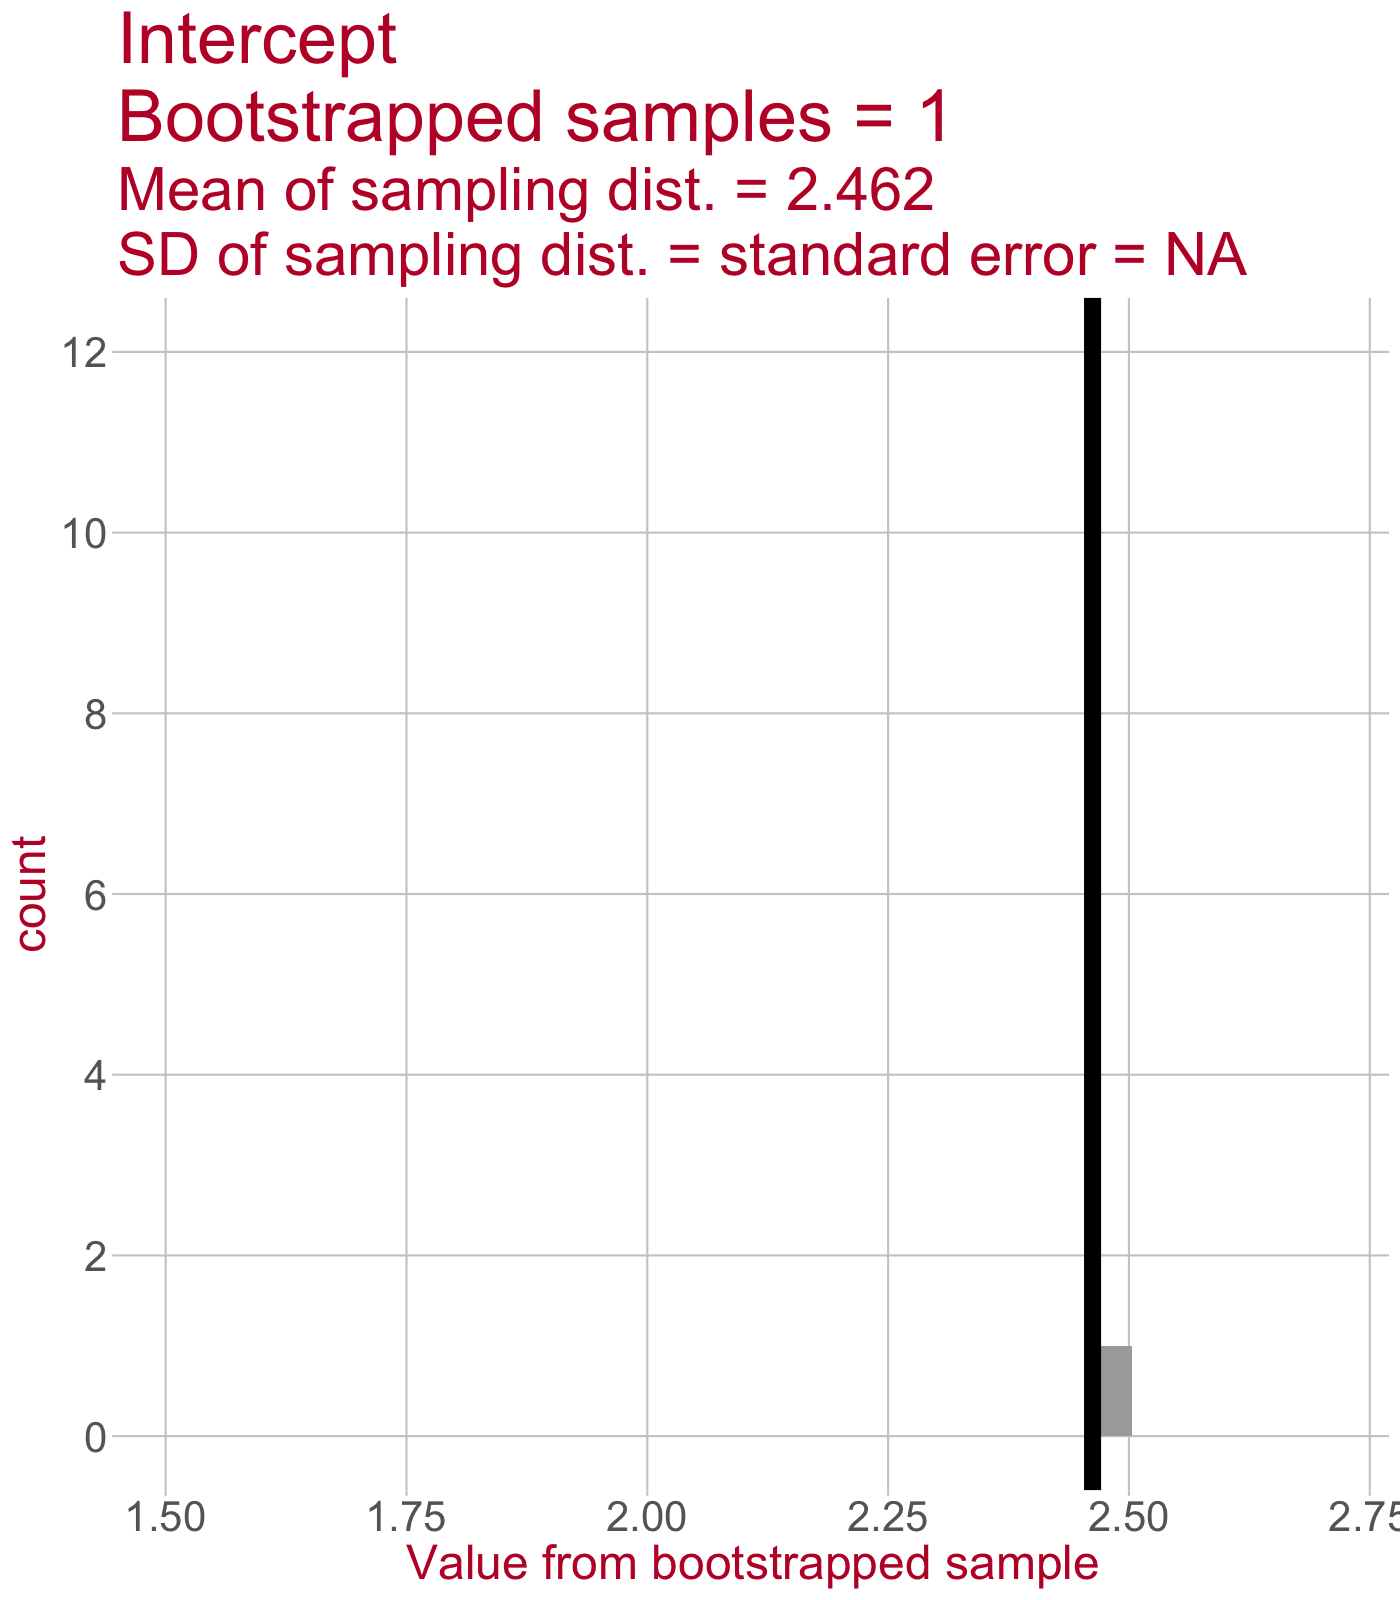
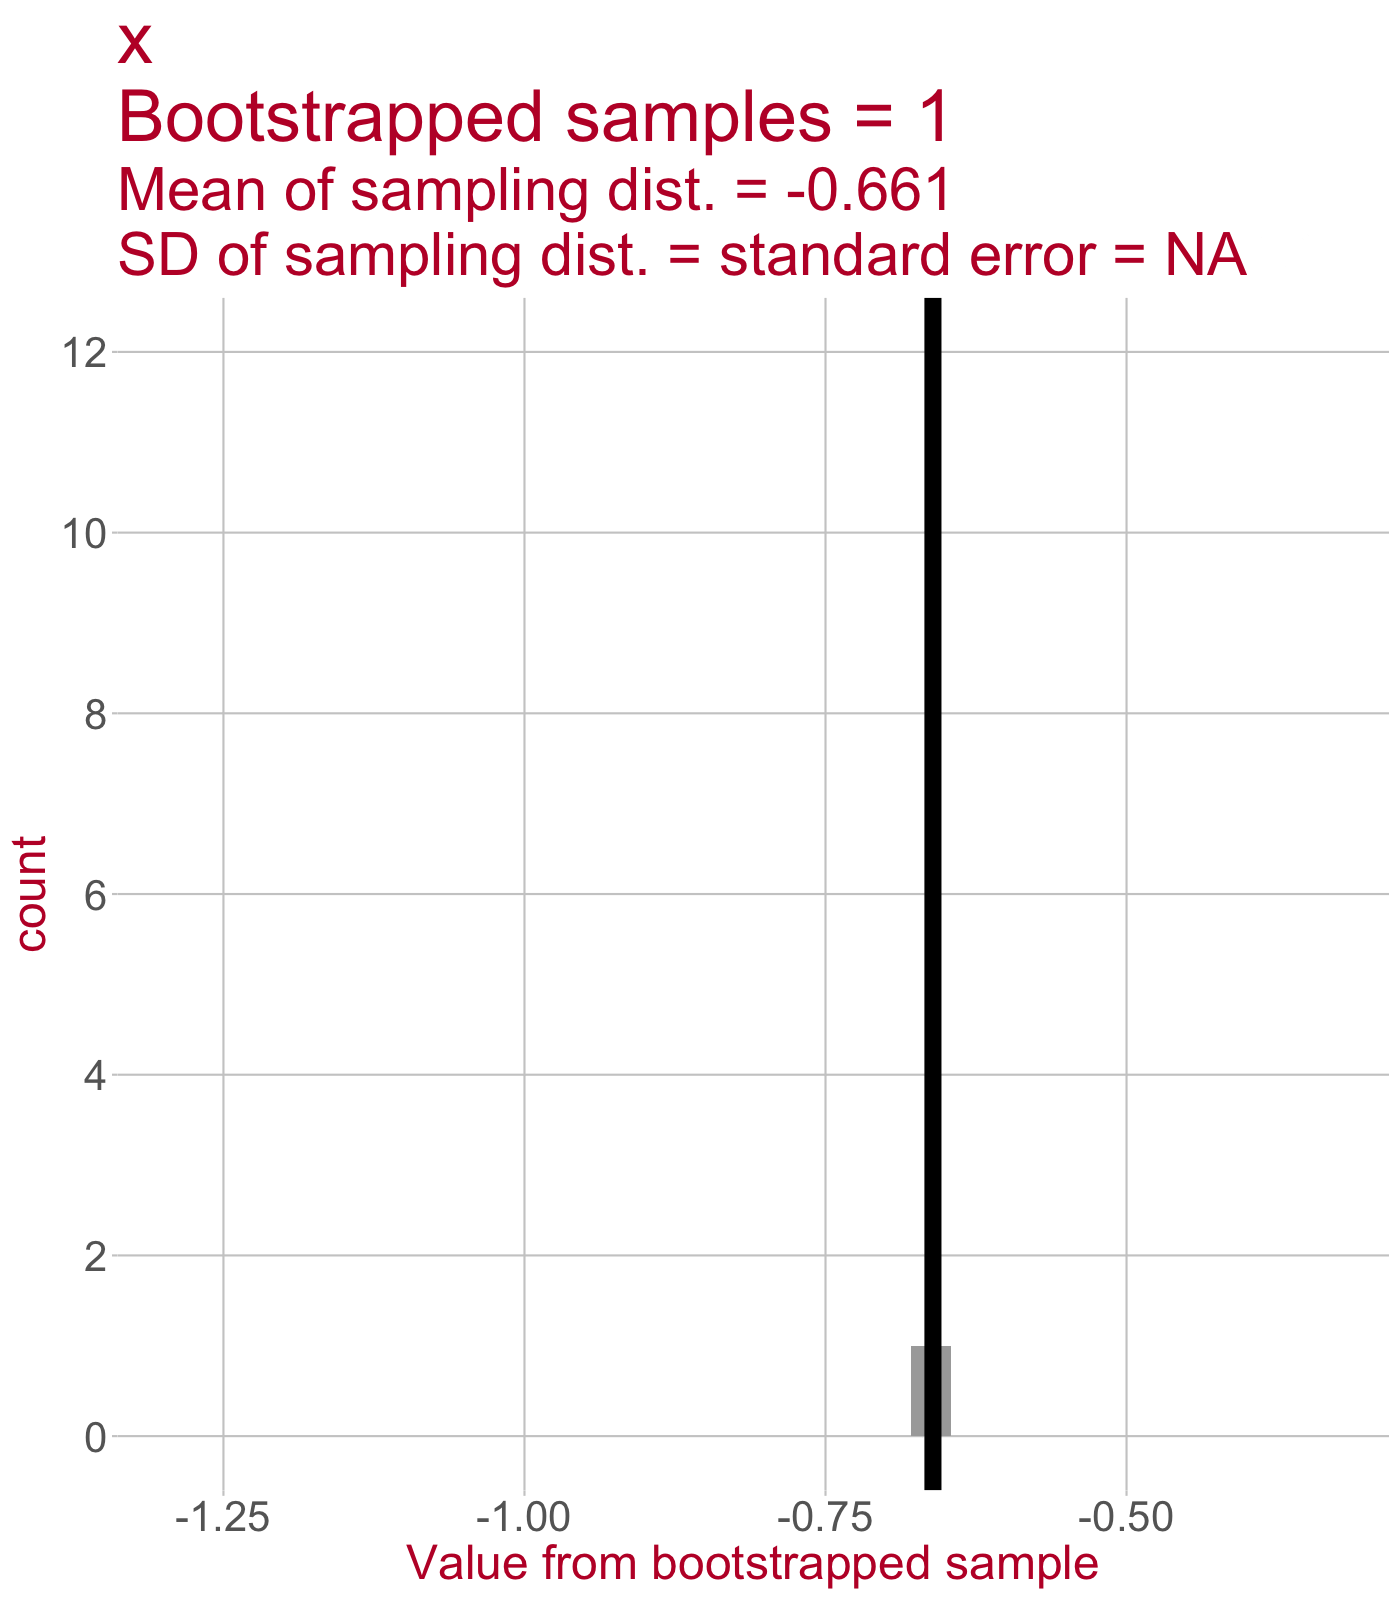
Bootstrapping, step by step
From the main sample, take a new sample with replacement. You always sample the same number of data points as there were in the main sample. One sample bootstrapped.
Fit the linear model to the bootstrapped sample. Save the intercept and slope estimates.
Do 1 and 2 again and again. We’ll get a sampling distribution of intercept estimates and a sampling distribution of slope estimates.
(1)

(2)
Call:
lm(formula = y ~ x, data = boot_samples[[1]])

Coefficients:
(Intercept)            x
      2.462       -0.661
(3)


Bootstrapping, step by step (Sample 2)
From the main sample, take a new sample with replacement. You always sample the same number of data points as there were in the main sample. One sample bootstrapped.
Fit the linear model to the bootstrapped sample. Save the intercept and slope estimates.
Do 1 and 2 again and again. We’ll get a sampling distribution of intercept estimates and a sampling distribution of slope estimates.
(1)

(2)
Call:
lm(formula = y ~ x, data = boot_samples[[2]])

Coefficients:
(Intercept)            x
      2.160       -0.663
(3)


Bootstrapping, step by step (Sample 3)
From the main sample, take a new sample with replacement. You always sample the same number of data points as there were in the main sample. One sample bootstrapped.
Fit the linear model to the bootstrapped sample. Save the intercept and slope estimates.
Do 1 and 2 again and again. We’ll get a sampling distribution of intercept estimates and a sampling distribution of slope estimates.
(1)

(2)
Call:
lm(formula = y ~ x, data = boot_samples[[3]])

Coefficients:
(Intercept)            x
      2.211       -0.684
(3)


Sampling distribution of the intercept
\(\leftarrow\) This sampling distribution consists of every Intercept value estimated by a linear model that was fit to a bootstrapped sample of data.
As we draw more bootstrapped samples, the mean Intercept (solid line) will come to match the original sample’s Intercept.
The standard deviation of the sampling distribution (dotted lines) = the standard error of the Intercept.
Sampling distribution of the slope
\(\leftarrow\) This sampling distribution consists of every slope value estimated by a linear model that was fit to a bootstrapped sample of data.
As we draw more bootstrapped samples, the mean slope (solid line) will come to match the original sample’s slope.
The standard deviation of the sampling distribution (dotted lines) = the standard error of the slope.
Bootstrapping is a different way of estimating a parameter’s standard error.
Manual bootstrapping closely matches Boot()
Number of bootstrap replications R = 1000
            original bootBias bootSE bootMed
(Intercept)    2.115 0.006860  0.183   2.124
x             -0.813 0.000135  0.160  -0.811

What do bootstraps have to do with stats?
Bradley Efron is the inventor of bootstrapping, and he introduced it in his 1979 paper by saying it’s a method

(Reader, the reasons did not become obvious.)
The internet’s best guess: it has to do with the saying “pull yourself up by your bootstraps”.
- Previously, this saying meant “a pointless/useless act”.
- These days, people use it to mean that
- you’re independent,
- you’re a self-starter,
- you’re standing on your own two feet.
- We think that “bootstrapping” is used in that sense: you can get estimates of uncertainty from just a single sample, so in a way, your sample is “pulling itself up by its bootstraps”.
Interpreting confidence intervals
It’s common to imagine that a 95% CI means that there’s a 95% probability that our true value is in the interval.

But this isn’t what they really mean! :(
We can simulate hypothetical repeated sampling by defining our own “reality”
Let’s look at the association between hours of sleep and the number of riddles solved in an hour.
In the real true population (which we have defined, in order to illustrate how confidence intervals work),
the true association looks like this:

Repeatedly draw samples from that true population and fit a linear model to each

Some 95% CIs of the slope don’t contain the true population value of 4

How many CIs contain the true value?
If we’re using a 95% CI, then we know that under hypothetical repeated sampling:
- 95 out of every 100 CIs will contain the true population value.
- 5 of every 100 CIs will not.

How many CIs contain the true value?
If we’re using a 60% CI, then we know that under hypothetical repeated sampling:
- 60 out of every 100 CIs will contain the true population value.
- 40 of every 100 CIs will not.

Building an analysis workflow


This week
Tasks

Attend your lab and work together on the exercises
Support

Help each other on the Piazza forum

Complete the weekly quiz

Attend office hours (see Learn page for details)