DAPR2 Assessed Group-Report 2024/25
General Info
Key Dates
Coursework set: 13th February 2025 (12 noon)
Coursework due: 6th March 2025 (12 noon)
Group Work Policy
Please note that:
- Each group should submit a single report (two documents: see Files to Submit)
- As this is a group-based report, no extensions are permitted
- All group members are expected and encouraged to contribute to the report, but you should not work with other groups. Similarity checks will be performed, and further investigations will be carried out if assignments from different groups are similar.
Use of AI
Academic integrity is an underlying principle of research and academic practice. All submitted work is expected to be your own. AI tools (e.g., ELM) should not be used for assessments on DAPR2. Using AI would constitute academic misconduct.
Instructions
Your task is to describe and analyse the data provided in order to answer a set of research question(s). Analyses will draw on the methodologies we have discussed in lectures and labs. The specific study contexts and research questions can be found below in the data & research questions section.
Structure & Rubric
Your report should include three sections - analysis strategy, results, and discussion.
Your report is marked based on four criteria - the analysis strategy, results, discussion, and writing and formatting. The associated grade percentage shown in ()’s below.
1. Analysis Strategy (40%)
In this section you should describe how you are going to address the research aim(s) of the study described. Note, you may not need as many analyses as there appear to be questions as some may use different pieces of information from the same analysis. The marking of this section will be based on the completeness of your descriptions of:
- data cleaning and variable recoding
- any descriptive statistics or visualizations you will use prior to running models
- the analyses you undertook (description of the models)
- how you will check your model (assumptions and diagnostics including the criteria you have used to evaluate each)
- what specific information from each model provides the answer to the questions including details of your \(\alpha\) levels and any required corrections
- rationales for all choices
Important:
- You do not need to include an introduction to the study unless you feel it is helpful in writing your analysis strategy
- Your analysis strategy should not contain any results
2. Results (40%)
The results section should follow logically from your analysis strategy and present the results of all aspects of your approach. A typical structure would begin by presenting descriptive statistics and move on to inferential tests. The marking of this section will be based on the completeness of your descriptions of:
- All key model results should be presented (tables very useful) in the main body of the report
- You should provide full interpretation of key results
- Model assumption and diagnostic checks should be noted (where you can refer the reader to both decision rules from your analysis strategy, and to figures included in the appendix)
3. Discussion (10%)
The Discussion section should be very brief (1-2 sentence). The marking of this section will be based on the completeness of your descriptions of:
- Concise, coherent and accurate summary statements linking the formal results to each of the research questions.
Important:
- This should not introduce any new statistical results, nor repeat detailed statistical results, but should refer to information presented in the other two sections of the report
Assumption and Diagnostics Appendix (Optional)
This optional section has no page limit. You may use this to present assumption and diagnostic plots.
Please note:
- You must still describe your assumption tests in your strategy, including how you will evaluate them
- You must still summarise the results in the results section of the main report
- You must refer accurately to the figures and tables labels presented in the appendix
For example:
good use of the appendix:
“The model met the assumptions of linear regression with residuals showing a constant mean of approximately zero across the fitted values (see Appendix X Fig X), and …”not so good use of the appendix:
“The model met assumptions (see Appendix X Fig X).”
Important:
- The assumption appendix is only for assumption and diagnostic figures and results. Any results from your main models including in the appendix will not be marked
Writing & Formatting (10%)
The focus of this report is on your ability to create reproducible results, implementing analyses to answer research questions and interpreting the results. However, we do require that the reports are neatly formatted and written clearly. This is especially important since the compiled report will not contain visible R code, and so a large part of the challenge comes in clearly describing all aspects of the analysis procedure. A reader of your compiled report should be able to more or less replicate your analyses without referring to your R code. Below are some pointers:
- Ensure writing is clear and well structured, use appropriate language avoiding unnecessary jargon or overly complex explanations
- Figures and tables should be numbered and captioned, and referred to in the text (including those contained within the Appendix); important statistical outcomes should be summarised in the text.
- Reporting should be clear and consistent. If in doubt, follow APA 7th Edition guidelines.
- Your report should be a maximum of 4 sides of A4 when the default formatting and font settings within RStudio are used when knitting your file. Please note, that no content beyond the 4th page will be read or marked (with the exception of the Appendix).
- Do not include a cover page - this will be included in the page limit
- Code chunks should be hidden in the pdf produced by your rmd file. To tell RMarkdown to not show your code when knitting to HTML, add
echo=FALSEnext to therthat appears after the backticks. There should be no visible R code or direct output in your report.
Important:
- The above also applies to your Appendix
Report Formatting
We expect pretty much all groups to do their analyses using RMarkdown (.Rmd; this is the type of file you’ve been working with in DAPR1 and DAPR2). However, you are welcome to write the report in a separate word-processor in order to format the report easily without having to remember the nuances of formatting in RMarkdown. This has the additional benefit of being able to use a collaborative word-processor such as Google Docs.
Unfortunately there are no straightforward ways to live edit .Rmd/.R documents collaboratively; we suggest that each group ensures it knows who holds the “master copy” of the script that will be submitted.
You should then export your word-processor document to .pdf format for submission. The code should remain as a file with a .Rmd or .R suffix.
We don’t mind which of these approaches each group takes: The important thing to remember is that the data analysis (cleaning, models, and plots) that are presented in the report should match those produced by your code.
For a guide on writing and formatting in RMarkdown, you may find these resources helpful:
Files to Submit
File Types
You are required to submit two files:
- a complete report knitted to PDF (i.e., in .pdf format)
- and the associated .Rmd/.R file that reproduces your report
Knitting .Rmd to PDF
Please note that to knit .Rmd directly to pdf, you should:
- Make sure the tinytex package is installed.
- Makes sure the ‘yaml’ (bit at the very top of your document) looks something like this. in
title, replace (GROUP NAME) with your group name (e.g., Asymptotic Antelopes), and inauthor, specify the exam number of each individual within the group (for example: B000001, B000002, B000003, …):
---
title: "DAPR2 Group Report (GROUP NAME)"
author: "B000001, B000002, B000003, ..."
date: "06/03/2025"
output: bookdown::pdf_document2
---
If you cannot knit directly to pdf, then try the following steps:
1) Knit to .html file
2) Open your html in a web-browser (e.g. Chrome, Firefox)
3) Print to pdf (Ctrl+P, then choose to save to pdf)
4) Submit the pdf you just saved.
File Names
For both files which you submit, the filename should be your group name with the appropriate extension, and nothing else.
For example, the group Asymptotic Antelopes would submit two files:
- one of AsymptoticAntelopes.Rmd / AsymptoticAntelopes.R
- AsymptoticAntelopes.pdf
For anyone who has obtained permission to complete the task individually, in the ‘yaml’ section of your .Rmd, name the title ‘DAPR2 Report’, and in author, specify your exam number.
Please name each file with your exam number (the letter “B” followed by a six digit number - which can be found on your student card: See here for more information). For example, if your exam number was B123456 you would submit:
- one of B123456.Rmd / B123456.R
- B123456.pdf
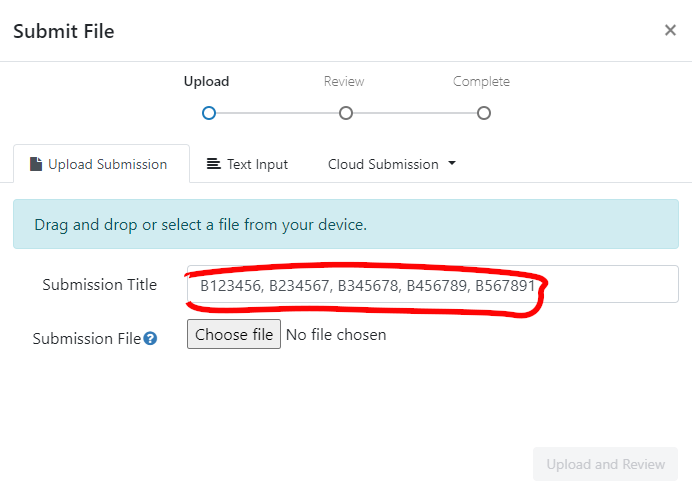
You should also write your exam number in the “Submission Title” box prior to submission.
Submitting Files
Who Submits & Where
ONLY ONE PERSON FROM EACH GROUP NEEDS TO SUBMIT
We suggest that you do this together in-person/on a call, so that all group members are able to confirm that they are happy to submit.
Please submit both files online via the Turnitin links on the LEARN page for DAPR2 (Go to the Report (Group Based) folder within the Assessments section on the Learn page). There will be two links, clearly labelled, as the files need to be submitted individually.
For each file you should complete the “Submit File” popup by entering the exam numbers of all of your group members in the “Submission Title” box (see below).
Grading
Report Grading
As mentioned above (see Structure & Rubric), compiled reports will be assessed according to the following components, with the following weightings:
- Analysis Strategy = 40%
- Results = 40%
- Discussion = 10%
- Writing and Formatting = 10%
The overall mark will be rounded to the nearest value on the Psychology 20-point marking scale.
We are primarily marking each group’s report, and not your code
Grades and feedback are provided for the finished reports, with marks awarded for providing evidence of the ability to:
- understand and execute appropriate statistical methods to answer each of the questions
- provide clear explanation of the methods undertaken
- provide clear and accurate presentation and interpretation of results and conclusions.
Why we still want your code
We still require your code so that we can assess the reproducibility of your work. The code provided must successfully conduct the analysis described in your report, and return the exact results, figures and tables that are detailed in your report. If it does not, then the code panalties outlined below will apply.
Peer-Adjusted Marking
Once the group project has been submitted, every member of the group will complete the peer-assessment, in which you will be asked to award “mark adjustments” to yourself and to each of the other members of your group. This will be done through Learn; details will be made available over the next couple of weeks. Each submitted mark should be understood as follows: Relative to the group as a whole, how much did each member contribute? If someone made an average contribution, you should award that person the middle score. If they contributed substantially more, you may choose to give a higher mark; if they genuinely contributed less, you might choose a lower mark. Marks for each group member are scaled then averaged together, and then used as “weights” to adjust the overall project mark. You can see an example of how this logic works by visiting https://uoe-psy.shinyapps.io/peer_adj/ where there is a “live demo” of a peer-adjustment system.
If you don’t contribute any peer-adjustment marks, the relative weight of the group members who do complete the peer-assessment will be higher.
The assessed group reports are marked on the Psychology 20-point marking scale, and peer-assessment ratings adjust grades by up to 20% of the report mark.
Penalties
Code
We will apply penalties for code errors or non-reproducibility.
Prior to submitting, check the following:
- Does the code run line-by-line without throwing any errors?
- Does the code provided lead to the exact same results that you have reported?
- Does the file knit successfully?
If any of the lines in your report generate an error, or the code doesn’t match the reported results, your grade will be penalised by deducting 10 points from your final grade.
In other words, a 62 becomes 52, and a 42 becomes 32.
If your submission files are not either .Rmd & PDF, you might lose all points and get a grade of zero.
If you have any technical issues with the Turnitin submission, please contact the Teaching Office, and cc the PPLS Psych Stats email address.
Late
Submissions are considered late until both files (in .Rmd & PDF format) are submitted on Turnitin.
Questions
We are here to help and to clarify anything we can, however we will not answer direct questions such as “Is this [part of my coursework] correct?”
What we would like you to do is think about why you are asking the question. If it is because you are unsure about a section of the material, look back over it, come and discuss the examples from class, and then apply that to the coursework.
Please ask questions on the discussion forum (Piazza) so that all students may benefit from the answer (please also check that your question has not already been posted!)
Data & Research Questions
Conduct and report on an analysis that addresses the research aims.
The data is available at: https://uoepsy.github.io/data/head_face_dominance.csv
Study Background and Aims
The data used for the current report are simulated, drawing on recent work on head position and social judgements. The simulated data acted to expand upon the methods and results reported in the following paper:
Witkower, Z., & Tracy, J. L. (2019). A facial-action imposter: How head tilt influences perceptions of dominance from a neutral face. Psychological Science, 30(6), 893–906. https://doi.org/10.1177/0956797619838762
Note you are not expected to provide an introduction, you do not have to read this article.
Method & Procedure
A total of 600 participants (aged 18-60) took part in a study examining the role of head tilt on the perception of dominance.
After entering the lab, all participants completed two questionnaires. The first questionnaire assessed generalised anxiety symptoms, measured by the self-report Generalised Anxiety Disorder Assessment (GAD-7). The second questionnaire assessed positive and negative affect (i.e., mood/emotion), measured by the self-report Positive and Negative Affect Schedule (PANAS).
Next, all participants were randomly allocated to view one of six target images. In all six target images, the emotion displayed was neutral, with the eyes directed straight ahead. The target images varied in their head tilt angle and in which part of the face was occluded. The target image had the face portrayed with either a 10° upward head tilt, a 10° downward head tilt, or no (i.e., 0°) head tilt, where either the upper or lower face was occluded. Participants were asked to rate the dominance of the presented target image.
Research Questions
After accounting for anxiety, positive and negative affect, the researchers want to know whether:
- differences in dominance ratings between face occlusion conditions depend on the head tilt condition.
- the difference in dominance ratings between face occlusion conditions differed between those that saw tilted and non-tilted heads.
Data Dictionary
| variable | description |
|---|---|
| PID | Participant ID. |
| age | Participant age (in years). |
| anxiety | Score on the GAD-7 scale (7 items scored on a 0-3 Likert scale) measuring generalised anxiety. Scores were calculated as the sum of the 7 items. Higher scores represented higher levels of anxiety. |
| negative_affect | Score on the negative subscale (10 items scored on a 1-5 Likert scale) of the PANAS Questionnaire. Negative affect scores were calculated as the sum of the 10 items within the subscale. Higher scores represented higher levels of negative affect. |
| positive_affect | Score on the positive subscale (10 items scored on a 1-5 Likert scale) of the PANAS Questionnaire. Positive affect scores were calculated as the sum of the 10 items within the subscale. Higher scores represented higher levels of positive affect. |
| tilt_condition | Head tilt condition - upwards = 10° upwards tilt; downwards = 10° downwards tilt; neutral = 0° no tilt. |
| occlusion_condition | Face occlusion condition - lower = lower occluded, only upper section of the face visible; upper = upper occluded, only lower section of the face visible. |
| dominance | Dominance rating (scored on a 8-56 scale). Higher scores represented higher levels of perceived dominance. |