DAPR2 Assessed Group-Report 2023/24
Department of Psychology, The University of Edinburgh
General Info
Key Dates
Coursework set: 15th February 2024 (12 noon)
Coursework due: 7th March 2024 (12 noon)
The grade will count towards 30% of the final course grade.
Group Work Policy
Please note that:
- Each group should submit a single report (two documents: see Files to Submit)
- As this is a group-based report, no extensions are permitted
- All group members are expected and encouraged to contribute to the report, but you should not work with other groups. Similarity checks will be performed, and further investigations will be carried out if assignments from different groups are similar.
Instructions
Your task is to describe and analyse the data provided in order to answers a set of research question(s). Analyses will draw on the methodologies we have discussed in lectures and labs. The specific study contexts and research questions can be found below.
Structure
Your report should include three sections:
1. Analysis Strategy
In this section you should describe how you are going to address the research aim(s) of the study described. Note, you may not need as many analyses as there appear to be questions as some may use different pieces of information from the same analysis. The marking of this section will be based on the completeness of your descriptions of:
- data cleaning and variable recoding
- any descriptive statistics or visualizations you will use prior to running models
- the analyses you undertook (description of the models)
- how you will check your model (assumptions and diagnostics including the criteria you have used to evaluate each)
- what specific information from each model provides the answer to the questions including details of your \(\alpha\) levels and any required corrections
- rationales for all choices
Your analysis strategy should not contain any results.
2. Results
The results section should follow logically from your analysis strategy and present the results of all aspects of your approach. A typical structure would begin by presenting descriptive statistics and move on to inferential tests. Things to remember:
- All key model results should be presented (tables very useful) in the main body of the report
- You should provide full interpretation of key results
- Model assumption and diagnostic checks should be noted (where you can refer the reader to both decision rules from your analysis strategy, and to figures included in the appendix)
3. Discussion (very brief)
The Discussion section should contain very brief (1-2 sentence) summary statements linking the formal results to each of the research questions. The marking of this section will be based on the coherence and accuracy of these statements. This should not introduce any new statistical results, nor repeat detailed statistical results, but should refer to those presented in the analysis.
Assumption and Diagnostics Appendix
In addition to the above, you may include an assumption appendix. This section has no page limit. You may use this to present assumption and diagnostic plots.
Please note:
- You must still describe your assumption tests in your strategy, including how you will evaluate them
- You must still summarise the results in the results section of the main report
- You must refer accurately to the figures and tables labels presented in the appendix
The assumption appendix is only for assumption and diagnostic figures and results. Any results from your main models including in the appendix will not be marked.
Finally, you do not need to include an introduction to the study unless you feel it is helpful in writing your analysis strategy.
Formatting
The focus of this report is on your ability to create reproducible results, implementing analyses to answer research questions and interpreting the results. However, we do require that the reports are neatly formatted and written clearly. Below are some pointers:
- Figures and tables should be numbered and captioned, and referred to in the text; important statistical outcomes should be summarised in the text.
- Reporting should be clear and consistent. If in doubt, follow APA 7th Edition guidelines.
- Your report should be a maximum of 4 sides of A4 when the default formatting and font settings within RStudio are used when knitting your file. Please note, that no content beyond the 4th page will be read or marked (with the exception of the Appendix).
- Do not include a cover page - this will be included in the page limit
- Code chunks should be hidden in the pdf produced by your rmd file. To tell RMarkdown to not show your code when knitting to HTML, add
echo=FALSEnext to therthat appears after the backticks. There should be no visible R code or direct output in your report.
For a guide on writing and formatting in RMarkdown, you may find these resources helpful:
As the compiled report will not contain visible R code, a large part of the challenge comes in clearly describing all aspects of the analysis procedure.
A reader of your compiled report should be able to more or less replicate your analyses without referring to your R code.
- Clear written details of the analysis conducted in order to answer the question, including transparency with regards to decisions made about the data prior to and during analysis.
- Results, in appropriate detail (for instance, a test statistic, standard error and \(p\)-value, not just one of these).
- Presentation of results where appropriate (in the form of tables or plots).
- Interpretation (in the form of written paragraphs referencing relevant parts of your results) leading to a conclusion regarding the question.
Code that will successfully conduct the analysis described in your report, and return the exact results, figures and tables that are detailed in your report.
Files to Submit
File Types
You are required to submit two files:
- a complete report knitted to PDF (i.e., in .pdf format)
- and the associated .Rmd file that reproduces your report
Knitting to PDF
Please note that to knit to pdf, you should:
- Make sure the tinytex package is installed.
- Makes sure the ‘yaml’ (bit at the very top of your document) looks something like this. in
title, replace (GROUP NAME) with your group name (e.g., Asymptotic Antelopes), and inauthor, specify the exam number of each individual within the group (for example: B000001, B000002, B000003, …):
---
title: "DAPR2 Group Report (GROUP NAME)"
author: "B000001, B000002, B000003, ..."
date: "15/04/2023"
output: bookdown::pdf_document2
---
If you cannot knit to pdf, then try the following steps:
1) Knit to .html file
2) Open your html in a web-browser (e.g. Chrome, Firefox)
3) Print to pdf (Ctrl+P, then choose to save to pdf)
4) Submit the pdf you just saved.
File Names
For both files which you submit, the filename should be your group name with the appropriate extension, and nothing else.
For example, the group Asymptotic Antelopes would submit two files:
- AsymptoticAntelopes.Rmd
- AsymptoticAntelopes.pdf
For anyone who has obtained permission to complete the task individually, in the ‘yaml’ section of your .Rmd, name the title ‘DAPR2 Report’, and in author, specify your exam number.
Please name each file with your exam number (the letter “B” followed by a six digit number - which can be found on your student card: See here for more information). For example, if your exam number was B123456 you would submit:
- B123456.Rmd
- B123456.pdf
You should also write your exam number in the “Submission Title” box prior to submission.
Submitting Files
Where to Submit
Please submit both files online via the Turnitin links on the LEARN page for DAPR2 (Go to the Report (Group Based) folder within the Assessments section on the Learn page). There will be two links, clearly labelled, as the files need to be submitted individually.
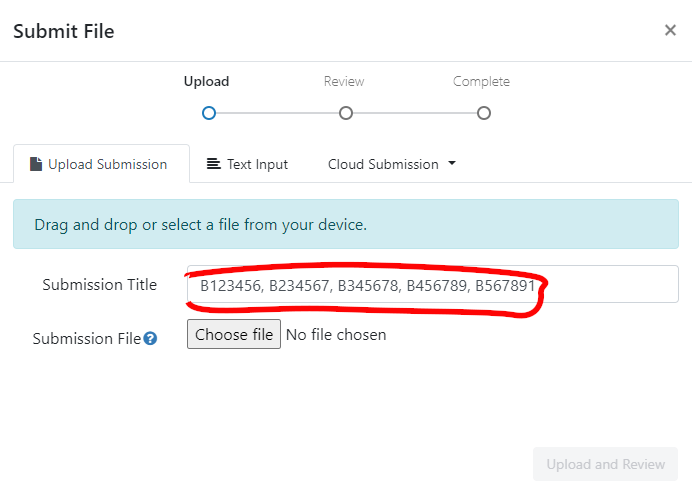
For each file you should complete the “Submit File” popup by entering the exam numbers of all of your group members in the “Submission Title” box (see below).
Who Submits
ONLY ONE PERSON FROM EACH GROUP NEEDS TO SUBMIT
We suggest that you do this together in-person/on a call, so that all group members are able to confirm that they are happy to submit.
Penalties
Code
We will apply penalties for code errors or non-reproducibility
Prior to submitting, check the following:
- Does the code run line-by-line without throwing any errors?
- Does the code provided lead to the exact same results that you have reported?
- Does the file knit successfully?
If any of the lines in your report generate an error, or the code doesn’t match the reported results, your grade will be penalised by deducting 10 points from your final grade.
In other words, a 62 becomes 52, and a 42 becomes 32.
If your submission files are not either .Rmd & PDF, you might lose all points and get a grade of zero.
If you have any technical issues with the Turnitin submission, please contact the Teaching Office, and cc the PPLS Psych Stats email address.
Late
Submissions are considered late until both files are submitted on Turnitin.
Grading
Report Grading
Compiled reports will be assessed according to the following components, with the following weightings:
- Analysis Strategy = 40%
- Results = 40%
- Discussion = 10%
- Writing and formatting = 10%
The overall mark will be rounded to the nearest value on the Psychology 20-point marking scale.
Peer-Adjusted Marking
Once the group project has been submitted, every member of the group will complete the peer-assessment, in which you will be asked to award “mark adjustments” to yourself and to each of the other members of your group. This will be done through Learn; details will be made available over the next couple of weeks. Each submitted mark should be understood as follows: Relative to the group as a whole, how much did each member contribute? If someone made an average contribution, you should award that person the middle score. If they contributed substantially more, you may choose to give a higher mark; if they genuinely contributed less, you might choose a lower mark. Marks for each group member are scaled then averaged together, and then used as “weights” to adjust the overall project mark. The assessed group reports are marked on the Psychology 20-point marking scale, and peer-assessment ratings adjust grades by up to 20% of the report mark.
You can see an example of how this logic works by visiting https://uoe-psy.shinyapps.io/peer_adj/ where there is a “live demo” of a peer-adjustment system.
If you don’t contribute any peer-adjustment marks, the relative weight of the group members who do complete the peer-assessment will be higher.
Questions
We are here to help and to clarify anything we can, however we will not answer direct questions such as “Is this [part of my coursework] correct?”
What we would like you to do is think about why you are asking the question. If it is because you are unsure about a section of the material, look back over it, come and discuss the examples from class, and then apply that to the coursework.
Please ask questions on the discussion forum so that all students may benefit from the answer (please also check that your question has not already been posted!)
Data & Research Questions
Conduct and report on an analysis that addresses the research aims.
The data is available at: https://uoepsy.github.io/data/dapr2_2324_report.csv
Study Background and Aims
The data used for the current report are simulated, drawing on recent work on violent video game and cortisol levels. The simulated data acted to expand upon the methods and results reported in the following paper:
Gentile, D. A., Bender, P. K., & Anderson, C. A. (2017). Violent video game effects on salivary cortisol, arousal, and aggressive thoughts in children. Computers in Human Behavior, 70, 39-43. https://doi.org/10.1016/j.chb.2016.12.045
Note you are not expected to provide an introduction, you do not have to read this article.
Method & Procedure
A total of 600 participants (aged 18-25) took part in a study examining the role of video-game play on physiological measures of stress.
After entering the lab, all participants completed two questionnaires. The first questionnaire assessed aggressive behaviour, measured by the self-report Aggression Questionnaire (AGQ). The second questionnaire assessed the socially aversive personality traits i.e., the Dark Triad (Machiavellianism, narcissism, and psychopathy), measured by the self-report Short Dark Triad (SD3) scale.
Next, all participants played the same (unreleased) video-game – “Anarchy: Retribution” - a first-person shooter (FPS) style game. Participants were randomly allocated into three playing conditions where they were assigned to either play the video-game on a touchscreen tablet, play on a games console with controller, or play using a virtual reality (VR) headset. The former two playing conditions (touchscreen tablet and games console with controller) represented non-immersive playing conditions, and the latter (VR) an immersive playing condition. Participants in all playing conditions were randomly allocated to into one of two player character conditions – either playing as a life-like person, or as a cartoon. Participants completed a 30-minute playing session of Anarchy: Retribution, where the aim was to complete several missions. During these missions, participants would be engaging in destruction of property (e.g., destroying buildings, setting fire to vehicles), hand-to-hand combat, and were tasked with eliminating enemies.
Before and after completing the gaming session, in order to obtain a physiological measure of stress, all participants provided saliva samples so that their cortisol levels (which is a physiological indicator of activation of the sympathetic nervous system i.e., the fight or flight response system) could be recorded. Differences in the two measures of cortisol were calculated to provide a single measure of ‘game-induced-stress’.
Research Questions
The researchers want to know whether, after accounting for aggressive behaviour and dark triad personality traits:
- do differences in game-induced-stress between player character conditions depend on the playing condition.
- whether the difference in game-induced-stress between player character conditions differs between those playing in non-immersive conditions and immersive conditions.
Data Dictionary
| variable | description |
|---|---|
| PPT_Name | Participant Name |
| M | Score on the Machiavellianism subscale (9 items scored on a 1-5 Likert scale) of the Short Dark Triad (SD3) scale. Machiavellianism scores were calculated as the mean of the 9 items within the subscale |
| N | Score on the Narcissism subscale (9 items scored on a 1-5 Likert scale) of the Short Dark Triad (SD3) scale. Narcissism scores were calculated as the mean of the 9 items within the subscale |
| P | Score on the Psychopathy subscale (9 items scored on a 1-5 Likert scale) of the Short Dark Triad (SD3) scale. Psychopathy scores were calculated as the mean of the 9 items within the subscale |
| AGQ | Score on the Aggression Questionnaire (AGQ). AGQ scores were calculated as the sum of 29 items scored on a 1-7 Likert scale |
| condition | Playing Condition (tablet = touchscreen tablet, console = games console with controller, vr = virtual reality headset) |
| character | Player Character Conition (cartoon = cartoon character, person = life-like person) |
| dcortisol | Game-Induced Stress Level (as calculated as the difference in two measures of cortisol) |