Formatting resources
This page contains formatting resources that will help you finalise your report formatting prior to submission.
1 Successful knitting checklist
If you encounter errors when knitting the Rmd file, go through the following checklist to try finding the source of the errors.
2 APA style reporting
Check the following guide for reporting numbers and statistics in APA style (7th edition).
3 Hiding code and/or output
To not show the code of an R code chunk, and only show the output, write:
```{r, echo=FALSE}
# code goes here
```
To show the code of an R code chunk, but hide the output, write:
```{r, results='hide'}
# code goes here
```
To hide both text output and figures, use:
```{r, results='hide', fig.show='hide'}
# code goes here
```
To hide both code and output of an R code chunk, write:
```{r, include=FALSE}
# code goes here
```
4 Figures
4.1 Combining plots
You can combine multiple plots into a single figure using the functions | and / from library(patchwork).
Suppose you stored four plots into objects named plt1, plt2, plt3, plt4. To combine the four plots into a single figure with 2 rows and 2 columns, you can use:
(plt1 | plt2) / (plt3 | pl4)The vertical bar | places figures side by side. The forward slash / starts a new row.
4.2 Reducing figure size
You can adjust the figure height and width with the following code chunk options: fig.height = ?, fig.width = ?. Substitute numbers where the ? are, and adjust by trial and error: e.g. 5 and 4, 12 and 8. Always keep in mind, that the figure labels should still be legible in your resulting plots.
```{r, fig.height = 5, fig.width = 4}
# your code to display the figure here
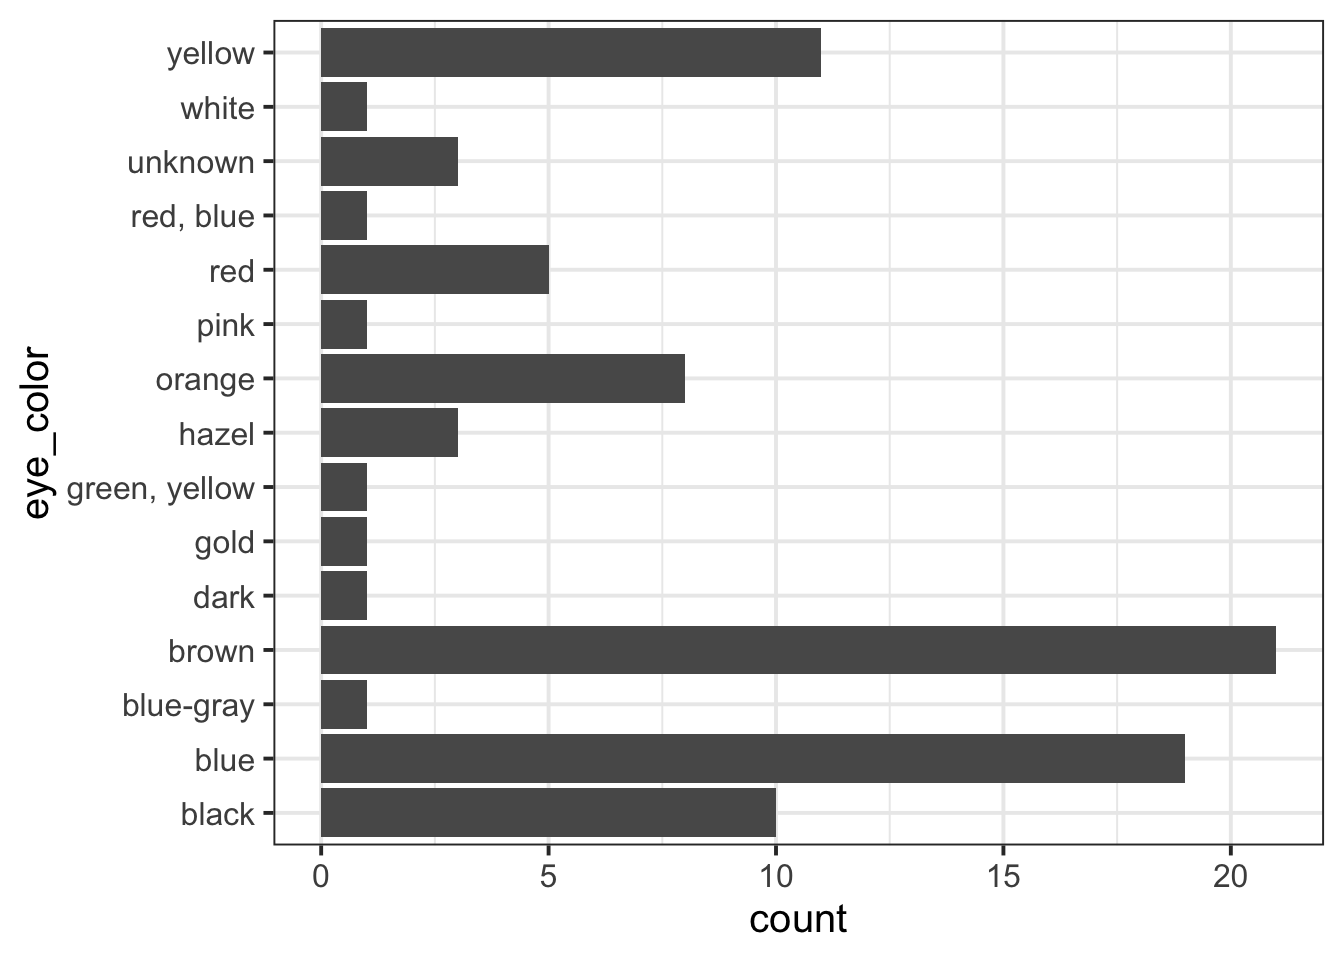
```4.3 Referencing figures
Step 1. Create a unique label for the code chunk that displays the figure, in this case UniqueFigureLabel but you should use a more descriptive name.
```{r UniqueFigureLabel, fig.cap = "Write a descriptive figure caption here"}
pltEye <- ggplot(starwars, aes(x = eye_color)) +
    geom_bar() +
    coord_flip()
pltEye
```To reference a figure, for example the one above, you would
write see Figure \@ref(fig:UniqueFigureLabel).which, when you Knit to PDF, becomes:
To reference a figure, for example the one above, you would write see Figure 1.
5 Tables
5.1 Pretty PDF tables
Suppose you created a descriptives table and stored it into tbl:
library(tidyverse)
tbl <- starwars |>
    group_by(eye_color) |>
    summarise(M = mean(height, na.rm = TRUE),
              SD = sd(height, na.rm = TRUE))
tbl
# A tibble: 15 × 3
eye_color M SD
<chr> <dbl> <dbl>
1 black 185 31.8
2 blue 182. 20.3
3 blue-gray 182 NA
4 brown 167. 34.1
5 dark NaN NA
6 gold 191 NA
7 green, yellow 216 NA
8 hazel 174 5.66
9 orange 180. 33.5
10 pink 180 NA
11 red 155. 53.4
12 red, blue 96 NA
13 unknown 136 80.6
14 white 178 NA
15 yellow 178. 42.2 You can create a properly formatted table for a PDF report using the kbl() or kable() functions from library(kableExtra).
::: {.cell}

```{.r .cell-code}
library(kableExtra)
tbl |>
    kbl(digits = 2, booktabs = TRUE, caption = "Write here a table caption")
```

::: {.cell-output-display}
`````{=html}
<table>
<caption>Write here a table caption</caption>
 <thead>
  <tr>
   <th style="text-align:left;"> eye_color </th>
   <th style="text-align:right;"> M </th>
   <th style="text-align:right;"> SD </th>
  </tr>
 </thead>
<tbody>
  <tr>
   <td style="text-align:left;"> black </td>
   <td style="text-align:right;"> 185.00 </td>
   <td style="text-align:right;"> 31.78 </td>
  </tr>
  <tr>
   <td style="text-align:left;"> blue </td>
   <td style="text-align:right;"> 182.21 </td>
   <td style="text-align:right;"> 20.32 </td>
  </tr>
  <tr>
   <td style="text-align:left;"> blue-gray </td>
   <td style="text-align:right;"> 182.00 </td>
   <td style="text-align:right;"> NA </td>
  </tr>
  <tr>
   <td style="text-align:left;"> brown </td>
   <td style="text-align:right;"> 167.32 </td>
   <td style="text-align:right;"> 34.11 </td>
  </tr>
  <tr>
   <td style="text-align:left;"> dark </td>
   <td style="text-align:right;"> NaN </td>
   <td style="text-align:right;"> NA </td>
  </tr>
  <tr>
   <td style="text-align:left;"> gold </td>
   <td style="text-align:right;"> 191.00 </td>
   <td style="text-align:right;"> NA </td>
  </tr>
  <tr>
   <td style="text-align:left;"> green, yellow </td>
   <td style="text-align:right;"> 216.00 </td>
   <td style="text-align:right;"> NA </td>
  </tr>
  <tr>
   <td style="text-align:left;"> hazel </td>
   <td style="text-align:right;"> 174.00 </td>
   <td style="text-align:right;"> 5.66 </td>
  </tr>
  <tr>
   <td style="text-align:left;"> orange </td>
   <td style="text-align:right;"> 180.50 </td>
   <td style="text-align:right;"> 33.53 </td>
  </tr>
  <tr>
   <td style="text-align:left;"> pink </td>
   <td style="text-align:right;"> 180.00 </td>
   <td style="text-align:right;"> NA </td>
  </tr>
  <tr>
   <td style="text-align:left;"> red </td>
   <td style="text-align:right;"> 154.80 </td>
   <td style="text-align:right;"> 53.36 </td>
  </tr>
  <tr>
   <td style="text-align:left;"> red, blue </td>
   <td style="text-align:right;"> 96.00 </td>
   <td style="text-align:right;"> NA </td>
  </tr>
  <tr>
   <td style="text-align:left;"> unknown </td>
   <td style="text-align:right;"> 136.00 </td>
   <td style="text-align:right;"> 80.61 </td>
  </tr>
  <tr>
   <td style="text-align:left;"> white </td>
   <td style="text-align:right;"> 178.00 </td>
   <td style="text-align:right;"> NA </td>
  </tr>
  <tr>
   <td style="text-align:left;"> yellow </td>
   <td style="text-align:right;"> 177.82 </td>
   <td style="text-align:right;"> 42.22 </td>
  </tr>
</tbody>
</table>
::: :::
::: {.cell}
::: {.cell-output-display}

`````{=html}
<table>
<caption>Write here a table caption</caption>
 <thead>
  <tr>
   <th style="text-align:left;"> eye_color </th>
   <th style="text-align:right;"> M </th>
   <th style="text-align:right;"> SD </th>
  </tr>
 </thead>
<tbody>
  <tr>
   <td style="text-align:left;"> black </td>
   <td style="text-align:right;"> 185.00 </td>
   <td style="text-align:right;"> 31.78 </td>
  </tr>
  <tr>
   <td style="text-align:left;"> blue </td>
   <td style="text-align:right;"> 182.21 </td>
   <td style="text-align:right;"> 20.32 </td>
  </tr>
  <tr>
   <td style="text-align:left;"> blue-gray </td>
   <td style="text-align:right;"> 182.00 </td>
   <td style="text-align:right;"> NA </td>
  </tr>
  <tr>
   <td style="text-align:left;"> brown </td>
   <td style="text-align:right;"> 167.32 </td>
   <td style="text-align:right;"> 34.11 </td>
  </tr>
  <tr>
   <td style="text-align:left;"> dark </td>
   <td style="text-align:right;"> NaN </td>
   <td style="text-align:right;"> NA </td>
  </tr>
  <tr>
   <td style="text-align:left;"> gold </td>
   <td style="text-align:right;"> 191.00 </td>
   <td style="text-align:right;"> NA </td>
  </tr>
  <tr>
   <td style="text-align:left;"> green, yellow </td>
   <td style="text-align:right;"> 216.00 </td>
   <td style="text-align:right;"> NA </td>
  </tr>
  <tr>
   <td style="text-align:left;"> hazel </td>
   <td style="text-align:right;"> 174.00 </td>
   <td style="text-align:right;"> 5.66 </td>
  </tr>
  <tr>
   <td style="text-align:left;"> orange </td>
   <td style="text-align:right;"> 180.50 </td>
   <td style="text-align:right;"> 33.53 </td>
  </tr>
  <tr>
   <td style="text-align:left;"> pink </td>
   <td style="text-align:right;"> 180.00 </td>
   <td style="text-align:right;"> NA </td>
  </tr>
  <tr>
   <td style="text-align:left;"> red </td>
   <td style="text-align:right;"> 154.80 </td>
   <td style="text-align:right;"> 53.36 </td>
  </tr>
  <tr>
   <td style="text-align:left;"> red, blue </td>
   <td style="text-align:right;"> 96.00 </td>
   <td style="text-align:right;"> NA </td>
  </tr>
  <tr>
   <td style="text-align:left;"> unknown </td>
   <td style="text-align:right;"> 136.00 </td>
   <td style="text-align:right;"> 80.61 </td>
  </tr>
  <tr>
   <td style="text-align:left;"> white </td>
   <td style="text-align:right;"> 178.00 </td>
   <td style="text-align:right;"> NA </td>
  </tr>
  <tr>
   <td style="text-align:left;"> yellow </td>
   <td style="text-align:right;"> 177.82 </td>
   <td style="text-align:right;"> 42.22 </td>
  </tr>
</tbody>
</table>
::: :::
5.2 Referencing tables
Say you created a tibble and stored it into tblEye. Please make sure you haven’t made it into a kbl() yet. Create a code chunk to display tblEye, and then pipe it into kbl() to make a table for a PDF file. You can also specify the table caption (caption = ““), whether to include tab lines (booktabs = TRUE), and whether to round to 2 digits (digits = 2). To reference a table you need to pick a unique label for the code chunk that displays the table, in this case anotherLabel but you should use a more descriptive name.
```{r anotherLabel, echo=FALSE}
tblEye |>
    kbl(booktabs = TRUE, caption = "Short table caption")
```| eye_color | n |
|---|---|
| black | 10 |
| blue | 19 |
| blue-gray | 1 |
| brown | 21 |
| dark | 1 |
| gold | 1 |
| green, yellow | 1 |
| hazel | 3 |
| orange | 8 |
| pink | 1 |
| red | 5 |
| red, blue | 1 |
| unknown | 3 |
| white | 1 |
| yellow | 11 |
The table is referenced as, see Table \@ref(tab:anotherLabel).Which, when you knit to PDF, is displayed as:
The table is referenced as, see Table 1.
For details on styling PDF tables, see this link.